


Similar Products
- Sale

- Sale
- Sale
- Sale
- Sale
- Sale


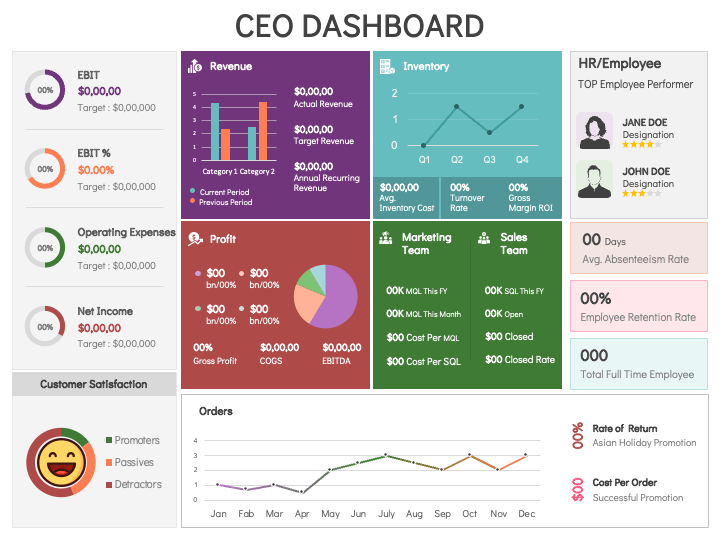
Leverage our CEO Dashboard slide for PowerPoint and Google Slides to showcase crucial business metrics and KPIs (key performance indicators) in a visually engaging manner. The slide comprises a dashboard infographic representing pie and donut charts, line and bar graphs, and more. The linking between this dashboard and Excel facilitates automatic updates, ensuring that any edits in the Excel file seamlessly reflect on this interface.
CEO and other senior executives can showcase overall revenue, revenue breakdown by product, region, or business unit, gross and net profit margins, key expenses, etc., to the board members and business partners. You can use this slide on various occasions, like quarterly business reviews, investor meetings, etc., to highlight sales figures, conversion rates, sales trends, production efficiency, inventory levels, market share, customer acquisition cost, etc. Further, you can explain how this dashboard helps top executives make informed decisions quickly.
Features
- You can quickly alter and adjust the layout to align with your presentation’s aesthetics.
- The optical resolution won’t get disturbed, even when projected on a widescreen.
- Our designers have crafted the visual from scratch to eliminate the room for copyright issues.
Lay your hands on this slide now!
Write Your Own Review

Related Products

