

Business Performance Dashboard for PowerPoint and Google Slides
Business Performance Dashboard for PowerPoint and Google Slides
(1 Editable Slide)
Related Presentation Templates
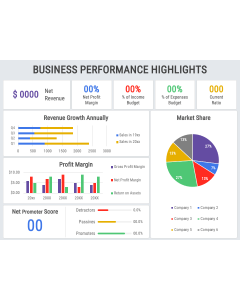
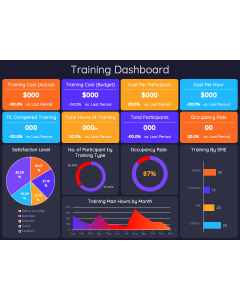
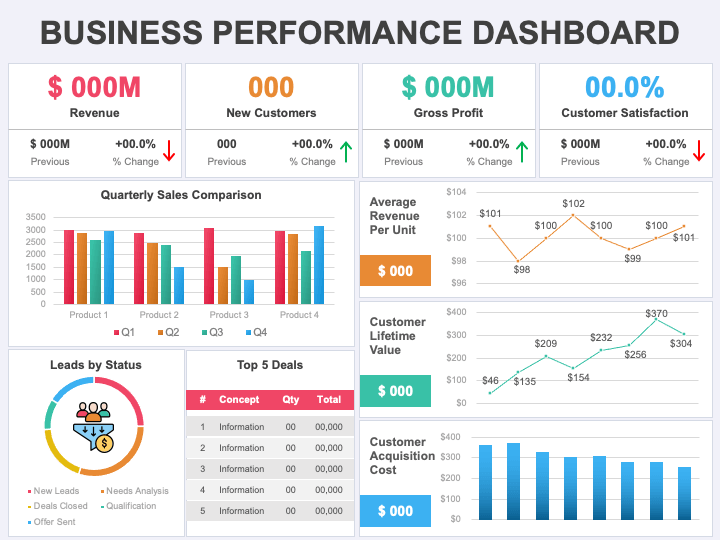
Our Business Performance Dashboard graphic for PowerPoint and Google Slides is now available for download. Grab it to add a visual perspective to your textual information and make it easier for the audience to comprehend. The slide features appealing layouts segregated into different sections presenting pie charts, bar graphs, and data and information like revenue, new customers, gross profit, etc.
This multipurpose PPT comes in handy for senior executives to provide an overview of the company’s overall performance to the board of directors, investors, and internal teams. Sales and marketing professionals can utilize this set to display sales figures, conversion rates, and marketing campaign analytics. Departmental heads and managers can highlight department-specific KPIs. Additionally, you can describe how this dashboard can aid in informed decision-making, strategy development, and effective communication of the company’s goals and progress.
Features
- The users can quickly make the desired changes to suit their needs and preferences.
- The graphics can be scaled to any extent without hampering optical resolution.
- Each set attribute is thoughtfully designed to ensure no user experiences copyright issues.
Get this PPT to deliver a stunning presentation and facilitate an easy understanding!