Progress Comparison PowerPoint and Google Slides Template
(3 Editable Slides)
Progress Comparison PowerPoint and Google Slides Template
Available For
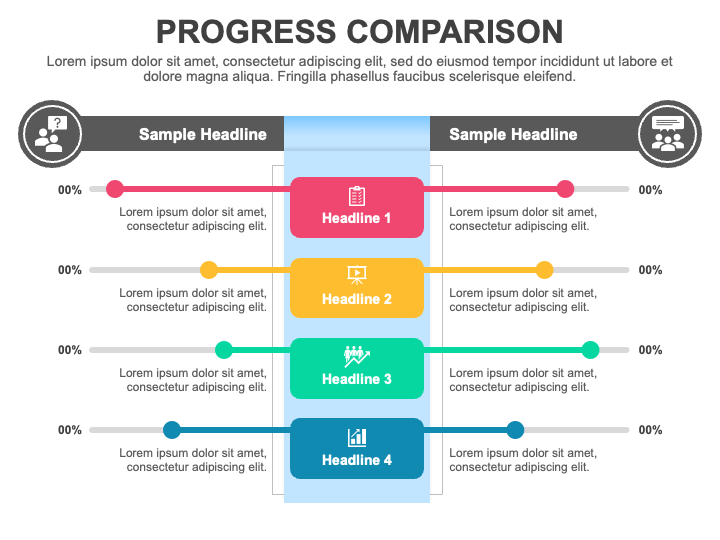
Our Progress Comparison template for PowerPoint and Google Slides is an ideal pick for senior executives to portray the comparison of the company’s growth over two consecutive periods. Financial professionals can use this set to showcase the performance comparison of two business units, facilitating informed decision-making and strategic planning. Sales and marketing managers can illustrate the comparison of sales figures, conversion rates, and market share between different products, regions, or periods. HR managers and team leads can demonstrate the comparison of employees' performance based on productivity metrics, such as project completion rates, task turnaround times, or other KPIs. Additionally, you can present the progress of different technology development phases.
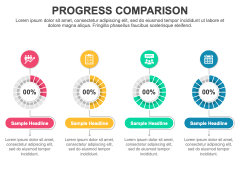
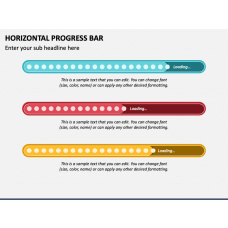
The slides comprise infographics of a comparison table and percentage graphics adorned with appealing icons and vibrant color combinations. Editable textual boxes accompany each visual to put the relevant and required content.
Features
- Edit the deck components to match your presentation’s theme without comprehensive technical expertise or external assistance.
- Projecting the graphics to any extent won’t affect their original quality or resolution.
- The set has been thoughtfully designed to eliminate the scope for copyright violation issues.
Grab this PPT without any second thought!

