
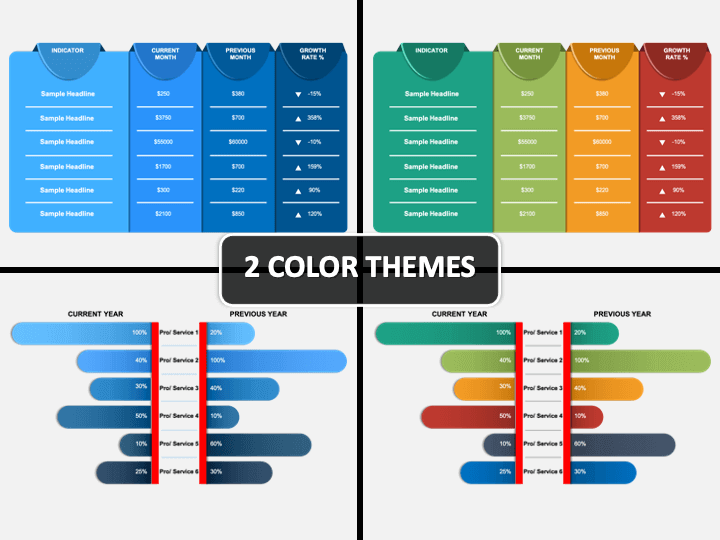
Current Vs Previous PowerPoint and Google Slides Template
(6 Editable Slides)


Current Vs Previous PowerPoint and Google Slides Template

SB3881
Available For


Similar Products
- Sale

-
-
- Sale
- Sale
- Sale

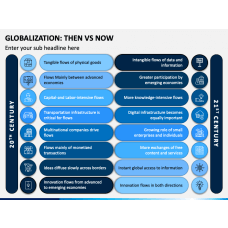

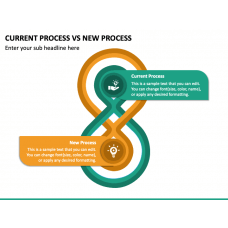
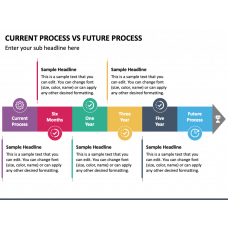
Tracking performance at regular intervals is essential to ascertain whether the organization is on the right path and making profits, or a gap exists between the expectations and reality. We have come up with an all-new Current Vs Previous PPT template through which you can beautifully showcase the comparison of your organizational current and previous performance. Leveraging the high-quality and vector-based illustrations, you can exhibit the monthly, quarterly, and yearly comparison between multiple aspects comprehensively while mentioning the reasons for the positive/negative difference.
Product managers, team leads, department heads, senior business executives, and business consultants can use this set to portray their team’s performance, change in a particular product’s demand, and much more. Furthermore, stealing the audience’s attention becomes very easy using this deck, as it has a unique combination of striking colors and high-definition infographics.
Key Attributes of the Set
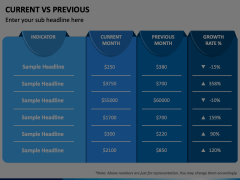
- Using the table depicted in one of the slides, you can illustrate the comparison of monthly sales, revenues, and profitability, and mention the difference as growth or reduction.
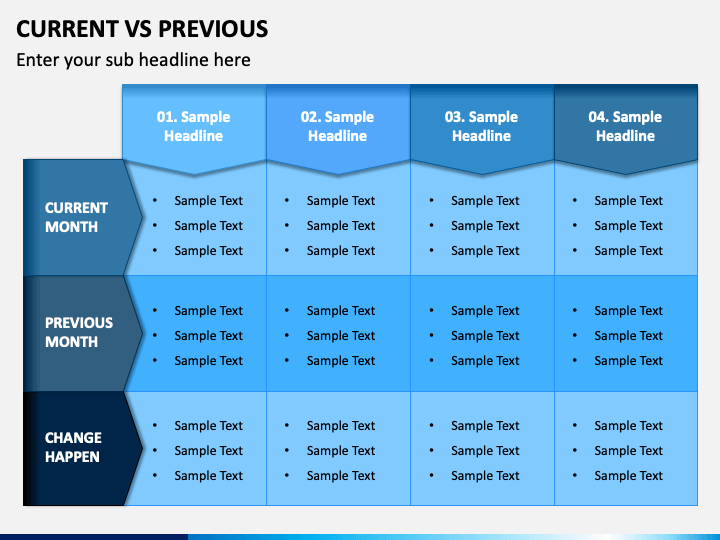
- The other one also contains a table that can be used to demonstrate the monthly comparison between multiple components and depict the reasons for the change/difference.
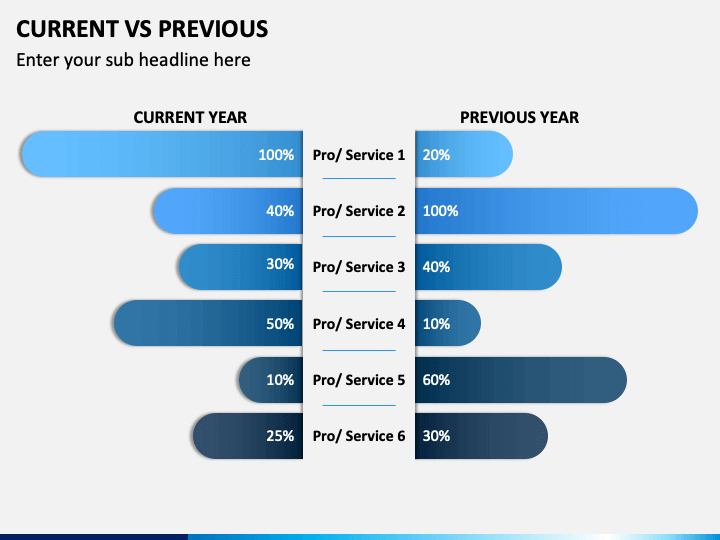
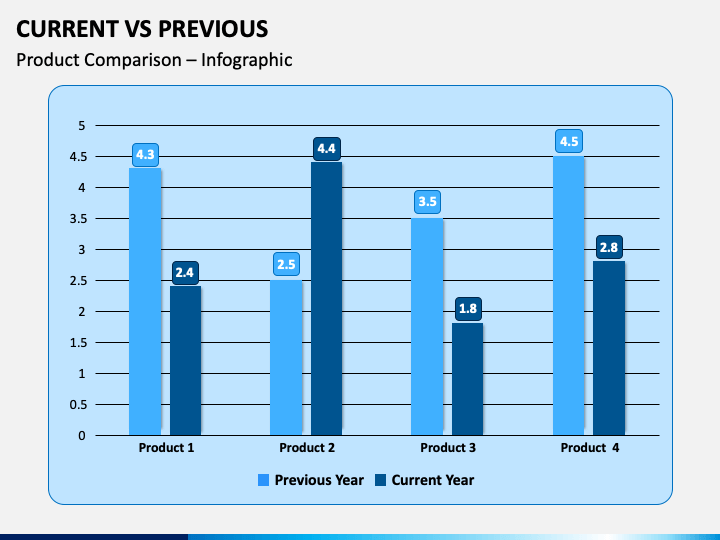
- The bar graphs showcased in some of the slides can be used to represent the yearly product/service performance comparison.
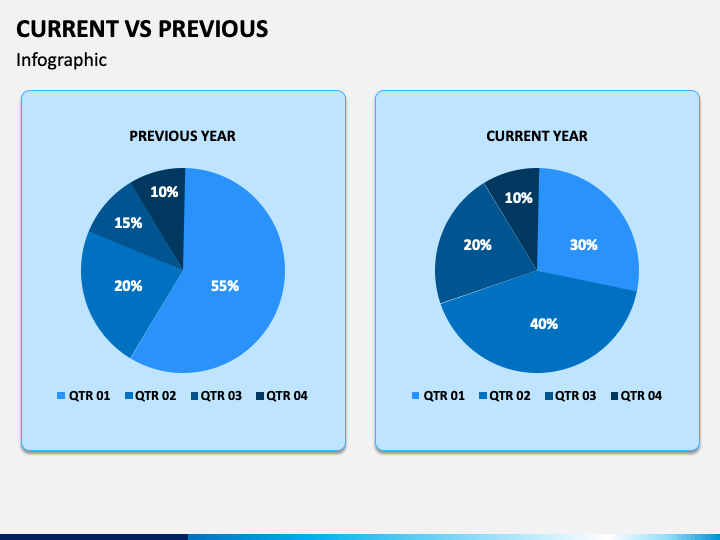
- Some slides contain two pie charts diagrams. One can be used to portray the quarter-wise performance of the current year, while the other one can be used to depict the previous year’s performance.
Features
- You can easily recolor and resize the visuals according to your requirements without any technical skills and external aid.
- There are no restrictions on including either one of the infographics or the complete deck in your existing and future presentations.
- Every illustration has been designed in high-resolution and from scratch to help you present on any screen size, without fretting about the quality issue.
- Perfectly compatible with MS PowerPoint, Apple Keynote, and Google Slides.
So, download it without any delay and win over the audience!
Write Your Own Review

Related Products


