

CVP Analysis PowerPoint and Google Slides Template
CVP Analysis PowerPoint and Google Slides Template
(5 Editable Slides)


(5 Editable Slides)
Related Presentation Templates
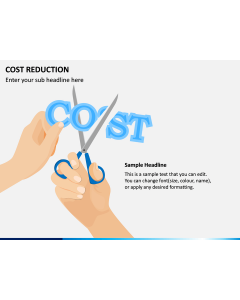
Explain how the varying levels of cost and volume impact the operating profit with our CVP Analysis PowerPoint template. Managers can use this fully editable deck to present the break-even point for different cost and sales volume structures. You can also explain to your team the role of this analysis in making short term economic decisions. Senior executives, startup owners, and entrepreneurs can use this set to depict the company's overall performance, the units required to be sold to break even (i.e., no profit or loss), and the effects of the different activity levels on the financial results. You can also use it to discuss how flexible budgets can be set.
The stunning color combinations and beautiful shading effects rightly set the tone for a creative yet professional-looking presentation. Using it, you can leave a lasting impression on your audiences. The PPT offers perfect compatibility with Microsoft PowerPoint, Apple Keynote, and Google Slides. So, download it right away!
All-in-One Deck
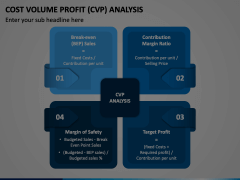
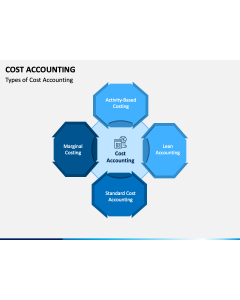
- Four essential components of cost-volume-profit (CVP) analysis, i.e., BEP Sales, Contribution Margin Ratio, Target Profit, and Margin of Safety and their formulas, have been depicted through a well-designed infographic.
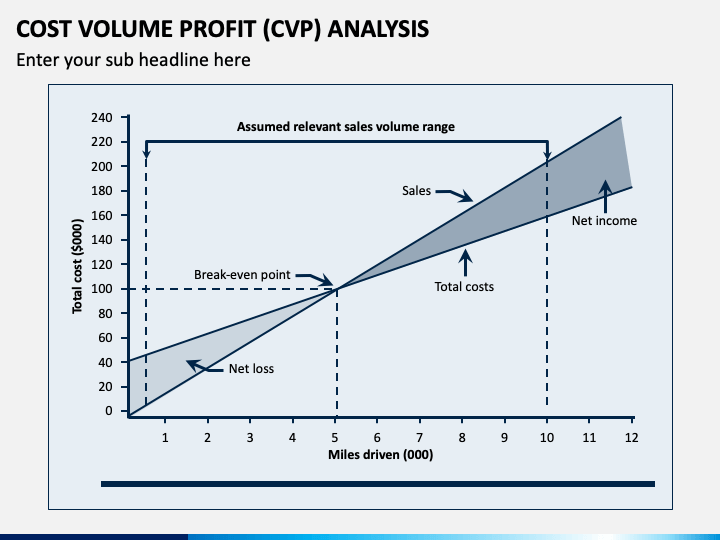
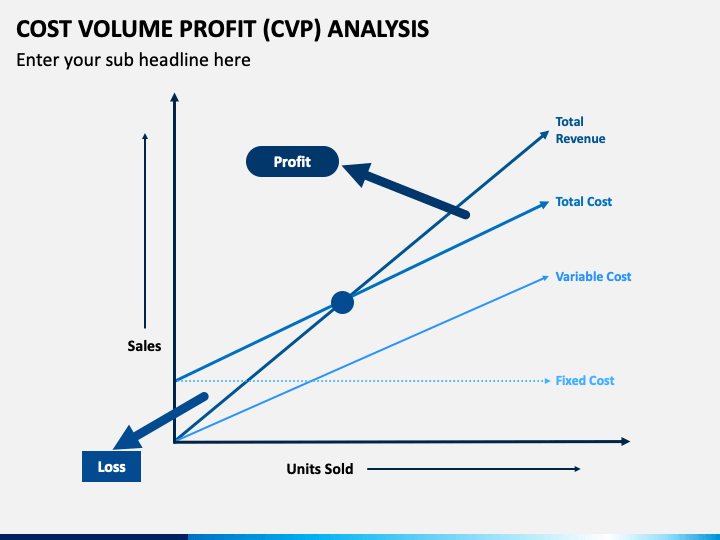
- A cost-volume-profit graph illustrates the relationship between sales, costs, volume, and profit. The total revenue line indicates how revenue increases as volume increases, and at the break-even point, there is a no-profit or loss situation.
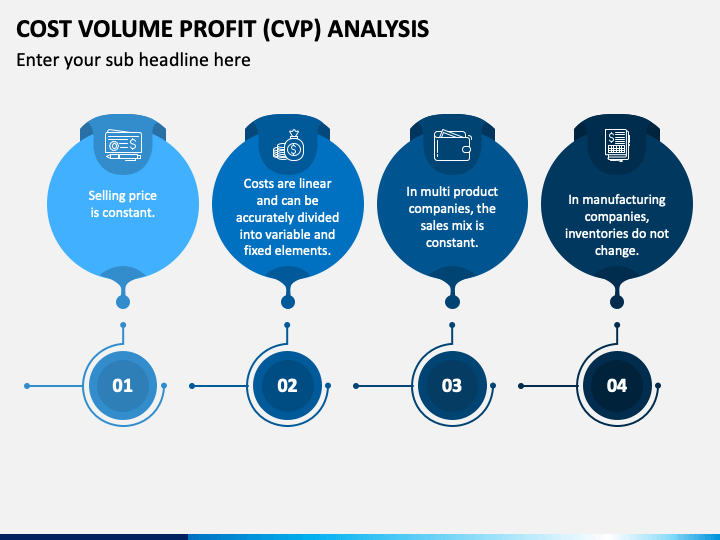
- The CVP model's assumptions have been presented with an infographic incorporated with relevant vector icons.
- A graph shows the break-even level, where the total sales revenue is equal to the costs incurred. Below the break-even point, the firm incurs losses while it makes profits above it. It also indicates how variable cost varies as per the varying activity levels, but the fixed cost remains the same.
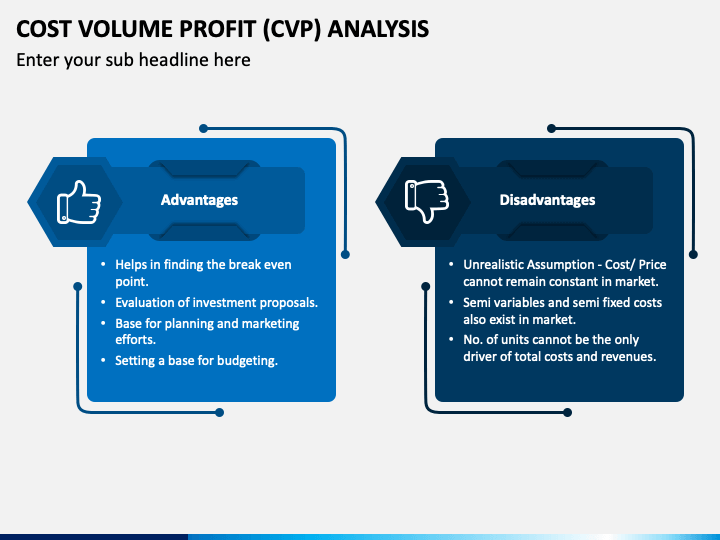
- The advantages and disadvantages have been explained in an easy-to-understand manner with the help of a beautifully-designed infographic.
Salient Features
- All the icons, illustrations, and diagrams can be resized and recolored quickly as per your needs, without seeking any external support.
- Use it for a lifetime by downloading it once.
- You are not required to possess technical editing skills to edit this PPT, as it is pretty easy to use.
- High-resolution graphics make it possible to present on large screens without impacting the quality.
Hurry up! Download our CVP Analysis PPT now and put across your message in a meaningful way to help your audience quickly grab the key takeaways!