Donut Diagram - 6 Segments
Donut Diagram - 6 Segments
(1 Editable Slide)
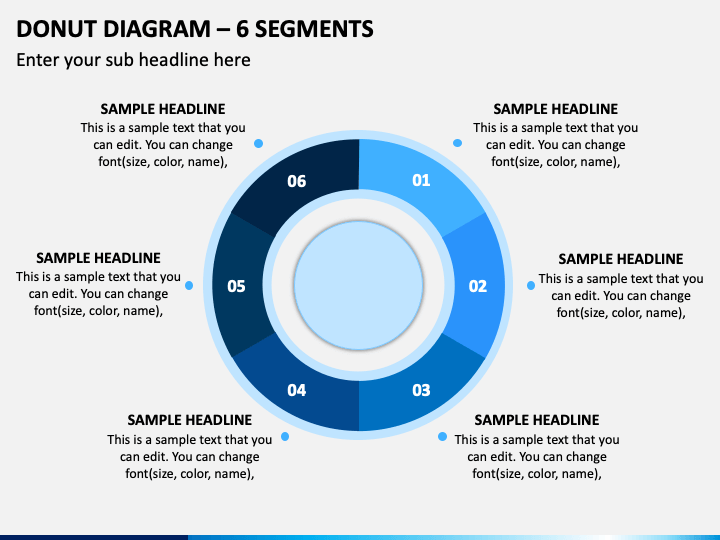
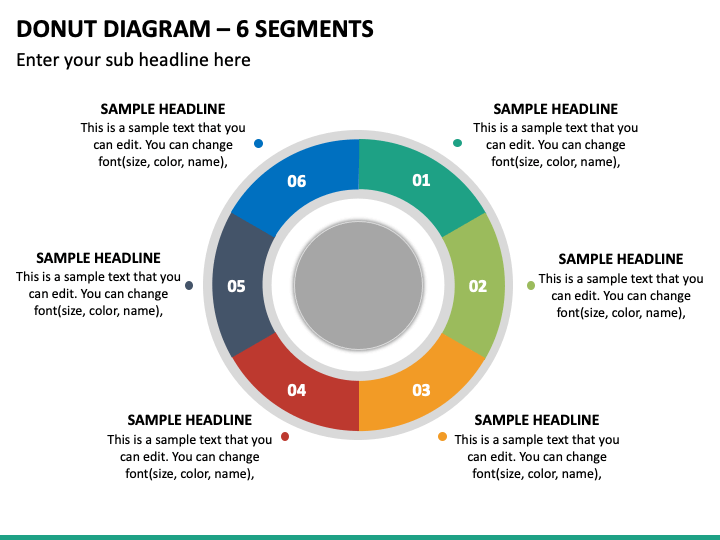
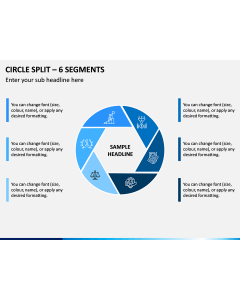

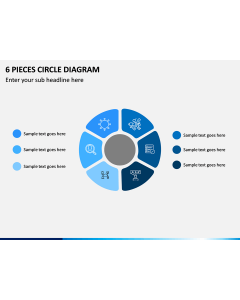
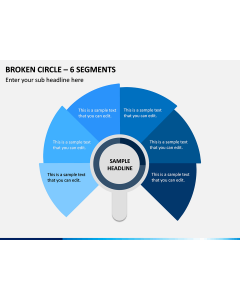
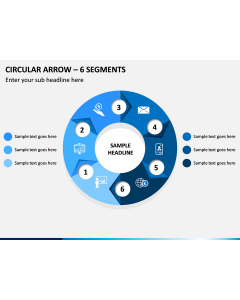
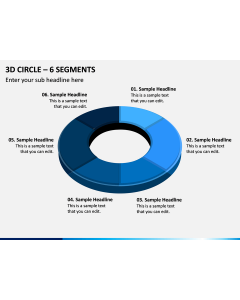
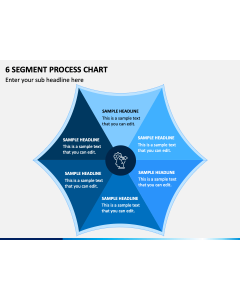
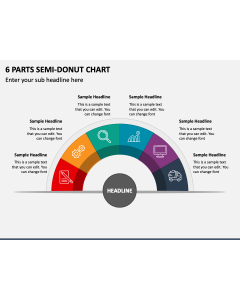
Download our striking Donut Diagram - 6 Segments PPT to visualize bulk data in an organized and easy-to-comprehend manner. The PowerPoint slide comprises a circular infographic segregated into six segments. Leveraging this beautiful illustration, sales managers can showcase the proportion of sales, revenues, and profitability of different products and services and business units. Senior executives can use this diagram to exhibit the areas to focus on for achieving sustainable growth. Business professionals can illustrate the steps of business planning, stages of change implementation, etc.
You can use this striking infographic in your current or future presentations to make them more appealing without encountering challenges. So, grab your hands on this PowerPoint slide now!
Compelling Features
- No user requires specialized skills to modify the illustration according to their needs.
- The users won't experience copyright violation issues, as the entire graphic is meticulously crafted.
- The resolution of the visual doesn’t get disturbed, even when projected on a widescreen.
Download this PPT now to deliver exquisite slideshows in no time!