

Downward Flow PowerPoint and Google Slides Template
Downward Flow PowerPoint and Google Slides Template
(8 Editable Slides)

Related Presentation Templates
Leverage our Downward Flow Infographics for PowerPoint and Google Slides to illustrate various concepts and trends involving downward movement. Senior executives can use these illustrations in their presentations to draw the attention of the board members to the areas where the company needs improvement, such as declining sales in a specific region. Business analysts can leverage this deck to portray the company’s decline in market share over time. Marketers can use these infographics to represent a drop in social media engagement and strategies for improving the metrics. Economists and educators can present a country’s data on declining GDP, employment, or inflation rates over specific periods. Financial advisors and trading experts can use this template to highlight downward trends in stock prices. Environmentalists can display reductions in air and water quality and depletion of natural resources over time.
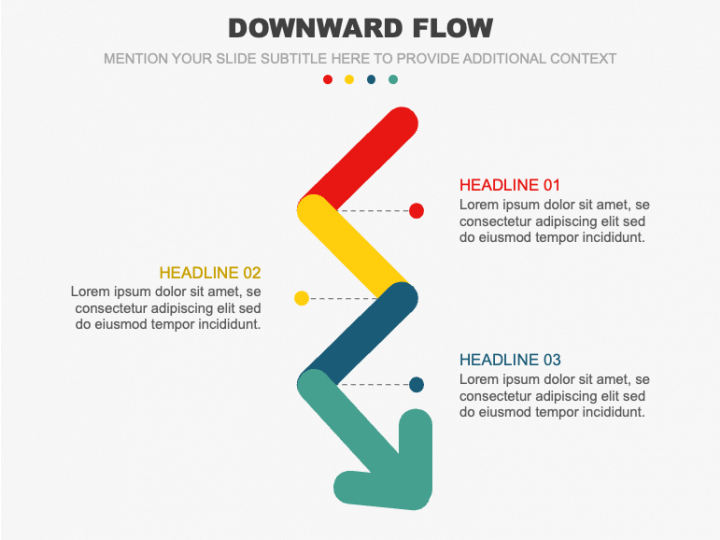
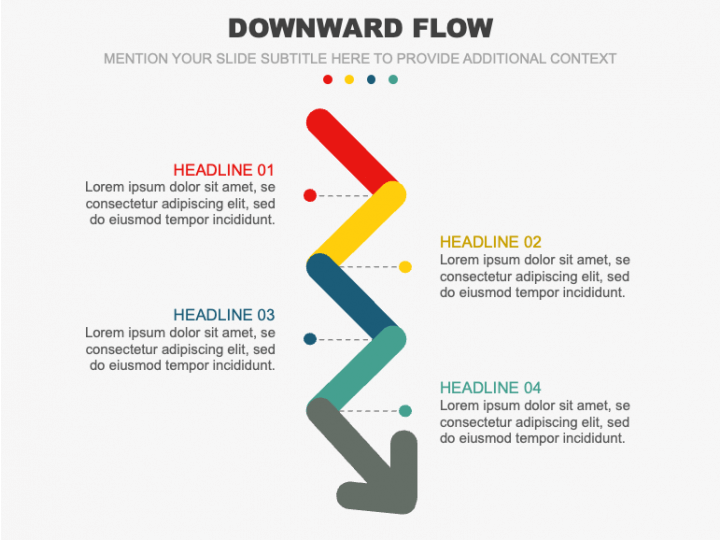
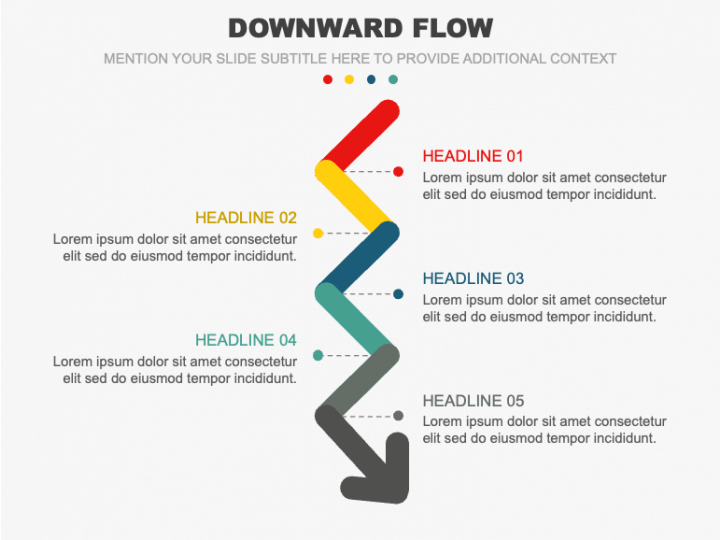
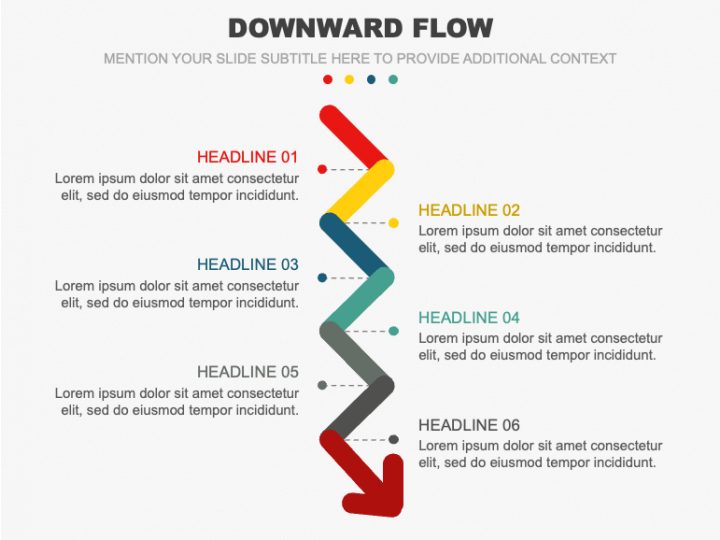
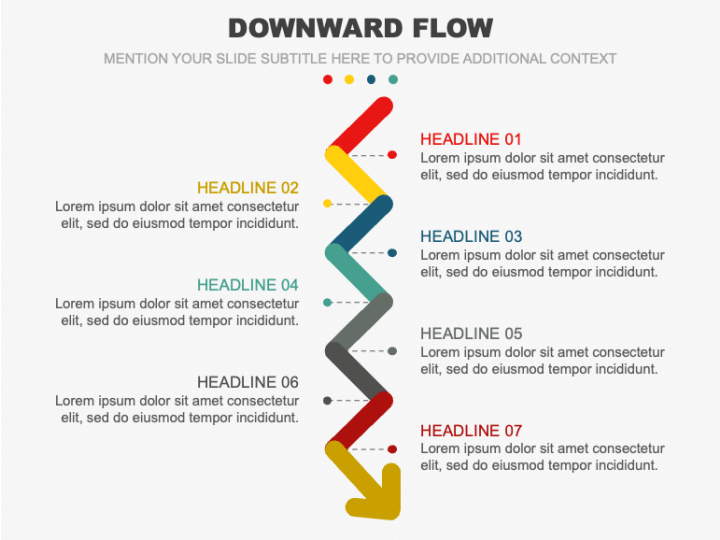
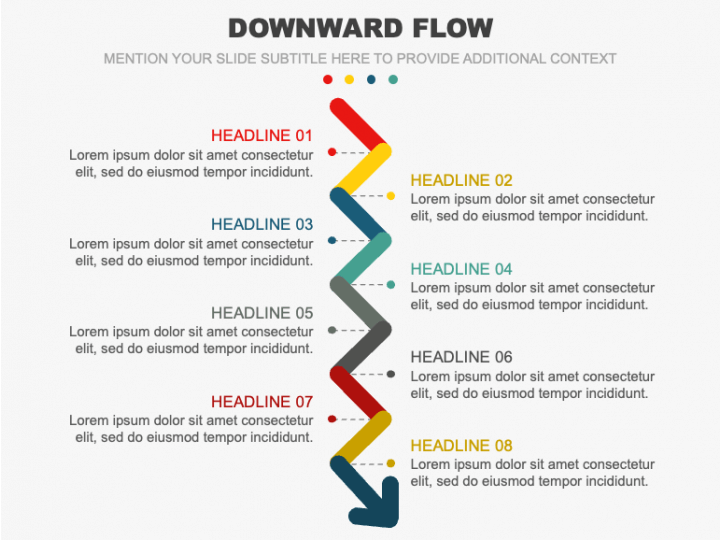
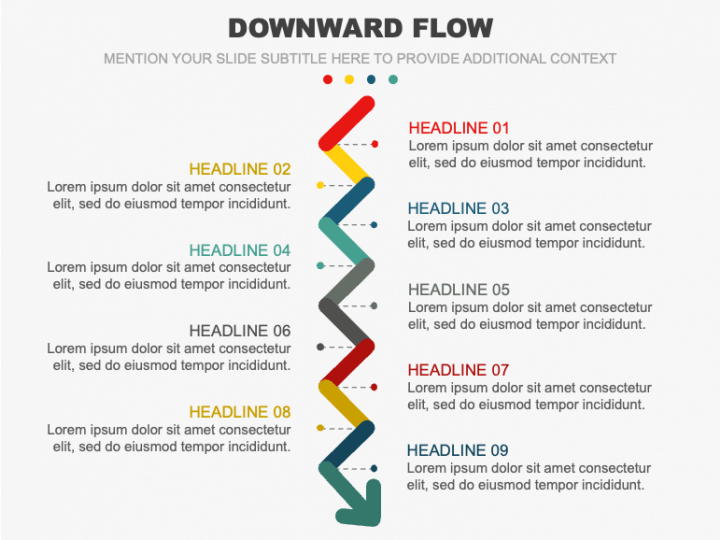
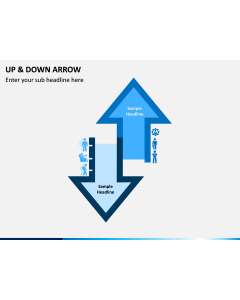
The slides feature various designs of zigzag downward-facing arrows adorned with bright color contrasts. Editable textual boxes in the visuals allow you to enter your desired textual information.
Features
- You can conveniently mold the designs to match your presentation’s aesthetics.
- The graphic quality won’t get disturbed, even when scaled to a bigger display.
- Each design has been meticulously designed to eliminate the room for issues related to copyright infringement.
Download this graphic-rich PPT to boost your presentation’s impact!