


Similar Products
- Sale

- Sale
The Economic Confidence Model PowerPoint and Google Slides Template
(6 Editable Slides)
- Sale
- Sale
-
- Sale


Download our Economic Inflation Illustration for PowerPoint and Google Slides to add a flair of creativity to your presentations. Educators can make the most of these visuals to complement the textual information regarding the types of inflation, their causes, effects, and measurement methodologies. Economists can use this graphic-rich PPT to display the economic factors contributing to high and low inflation, forecasted inflation rates based on historical data and trends, the role of central banks in controlling inflation, etc. Business consultants can demonstrate how businesses can adjust their strategies in response to inflation. Additionally, you can provide insights into how investors can protect their portfolios during inflationary periods.
The Slides’ Overview
The PPT comprises-
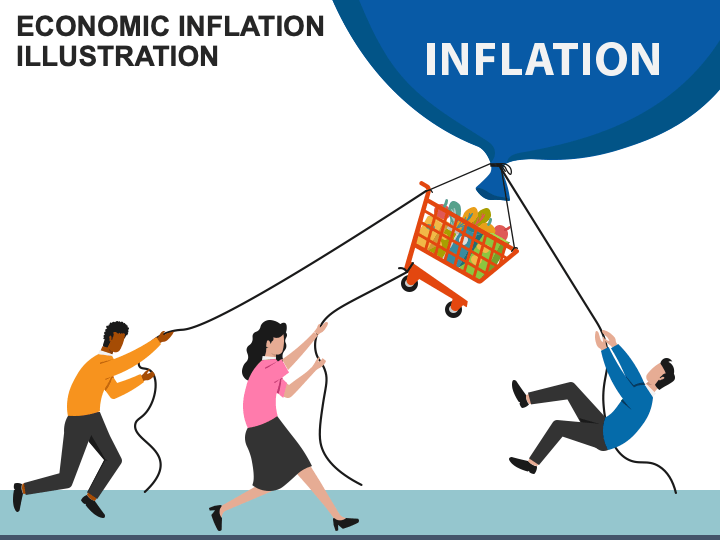
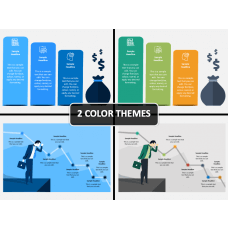
- An infographic of individuals pulling down a balloon and a cart.
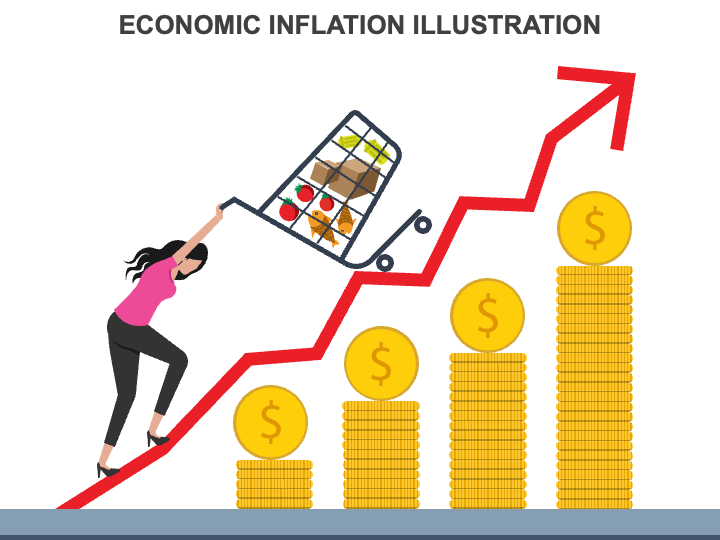
- An illustration of a woman pushing the cart upwards on a zigzag arrow, positioned on coins arranged in the form of a ladder.
Features
- Edit the visuals without special editing tools or external assistance.
- The graphics’ original quality and resolution will remain unchanged, even when scaled to a widescreen.
- All attributes are thoughtfully designed to prevent copyright issues.
Grab this PPT right away!
Write Your Own Review

Related Products


