Economic Growth Illustration
Economic Growth Illustration
(2 Editable Slides)
Related Products


Lay your hands on our Economic Growth Illustration presentation graphics for PowerPoint and Google Slides to demonstrate the increase in the production and consumption of services and goods within an economy. The sample text in the editable text placeholders can easily be substituted with your content.
This PPT is a valuable visual resource for economists and economic analysts to showcase the factors influencing economic growth in different regions and countries, economic trends, and the relationship between international trade and economic growth. Government officials and policymakers can leverage these graphics to illustrate the impact of policies on the growth and development of the economy and the strategies designed to promote economic growth. Market researchers can highlight the role of market trends, demand patterns, and consumer behavior in economic growth.
Powerful Designs for Compelling Data Visualization
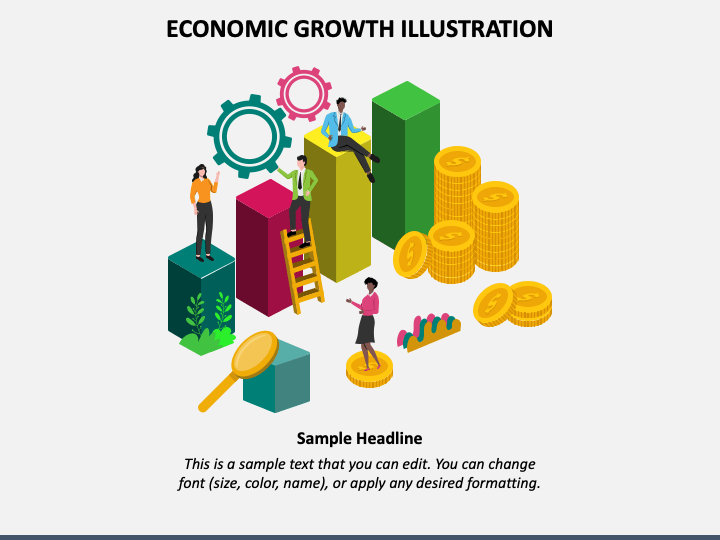
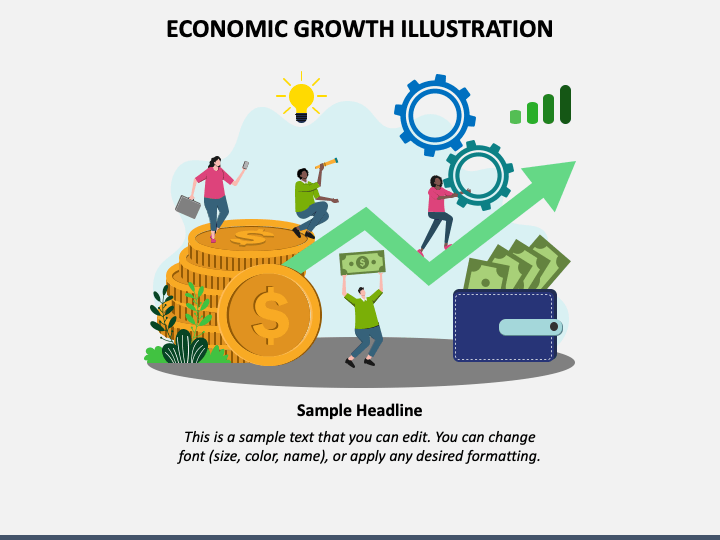
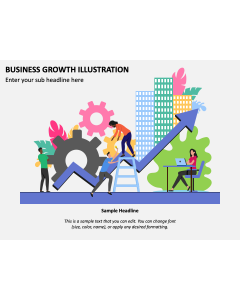
The slides depict infographics of-
- An upward-moving graph with people standing and sitting on it and stacks of coins.
- People sitting and standing on stacks of coins and upward-moving arrows.
Distinct Features
- The high-definition graphics ensure exceptional resolution and quality on large screens.
- The vectors have been prepared after careful research to prevent potential copyright problems.
- If you face any issues, our competent customer care executives are available to assist you.