Employee Infographics for PowerPoint and Google Slides
Employee Infographics for PowerPoint and Google Slides
(11 Editable Slides)
Leverage our Employee Infographics for PowerPoint and Google Slides to showcase various aspects of your workforce in a visually engaging and easy-to-understand manner. HR professionals can use these illustrations to depict their organizational workforce composition, initiatives to promote diversity and inclusion, improve employee satisfaction scores, etc. Project managers can display an overview of their team members, including key skills and expertise to clients. Team leaders can highlight team hierarchies and reporting lines, helping senior management make informed decisions related to resource allocation. Sales professionals can display the productivity levels and sales performance of sales executives over a specific period. Additionally, you can display the significance of celebrating employees’ successes to motivate and encourage them to go the extra mile to attain organizational goals.
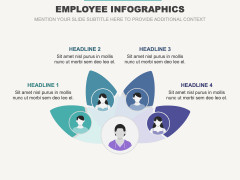
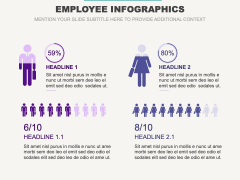
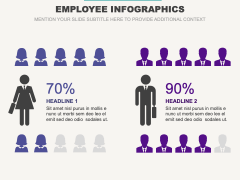
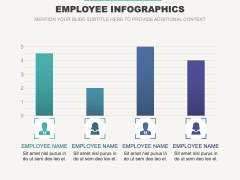
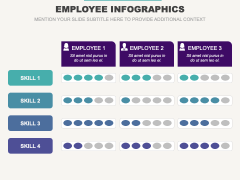
The slides comprise an infographic of flower petals, male and female silhouettes with percentage signs, bar graphs, a tabular infographic, self-explanatory icons, and bright color contrasts. Harness these interactive elements to add meaning to your textual information and facilitate an easy understanding.
Features
- Customizing the visuals to align with your presentation’s aesthetics is fuss-free.
- You can project the graphics on any screen dimension without compromising the original quality and resolution.
- Everything has been thoughtfully designed to ensure no user confronts copyright issues.
Download this graphic-rich PPT to improve the overall visual appeal of your slideshow!
