

Inventory Management Dashboard for PowerPoint and Google Slides
Inventory Management Dashboard for PowerPoint and Google Slides
(1 Editable Slide)
Related Presentation Templates
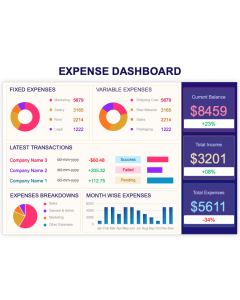
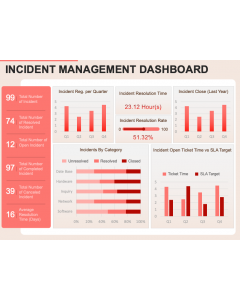
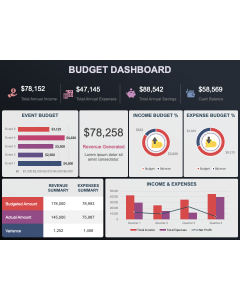
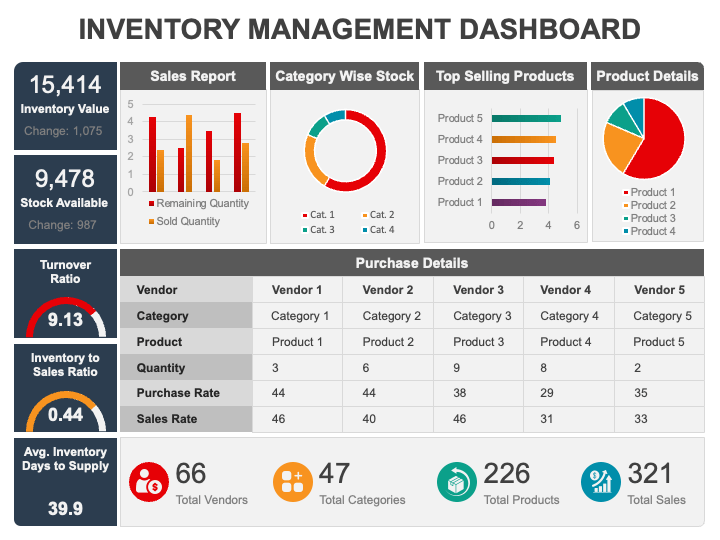
Grab our Inventory Management Dashboard slide for PowerPoint and Google Slides to provide a real-time view of a company’s inventory status and current stock level of each item. The slide features a dashboard layout showcasing a bar graph, a donut chart, a pie chart, a table, etc. The appealing icons and bright color contrasts will help you present your content impressively and foster improved comprehension. Moreover, the data-driven dashboard is connected with Excel; hence, changes made in the spreadsheet will be reflected in it.
Inventory managers can highlight the inventory turnover ratio, low stock or overstock of a specific product, and reorder points. Sales managers can display sales trends and top-selling and slow-moving products. Data analysts can use this infographic to depict forecasted inventory needs based on current inventory levels and how often a specific product is sold and replaced. Warehouse managers can portray warehouse capacity utilization, inventory carrying costs, value of current inventory, etc.
Features
- Entirely editable
- High-quality graphics
- Copyright-free
- 24/7 customer support
- Reusable for a lifetime
Download this PPT now!