
Linear Venn Diagram for PowerPoint and Google Slides
(12 Editable Slides)


Linear Venn Diagram for PowerPoint and Google Slides

SB2536
Available For


Tags:
Similar Products
- Sale

-
- Sale
-
- Sale
-


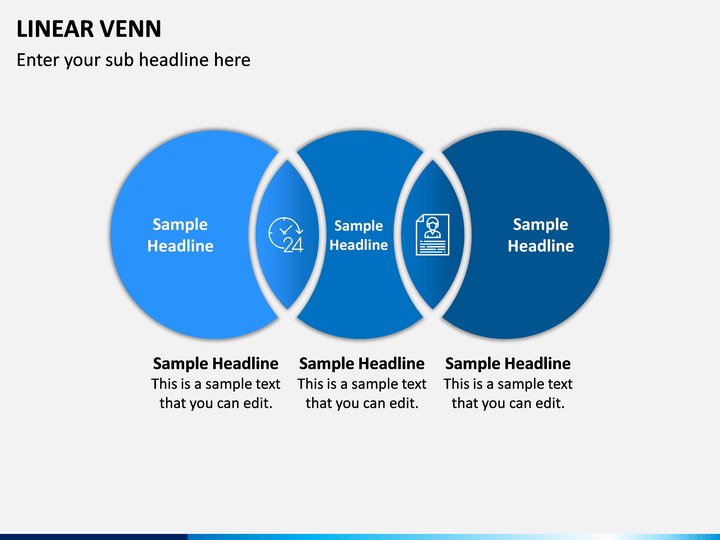
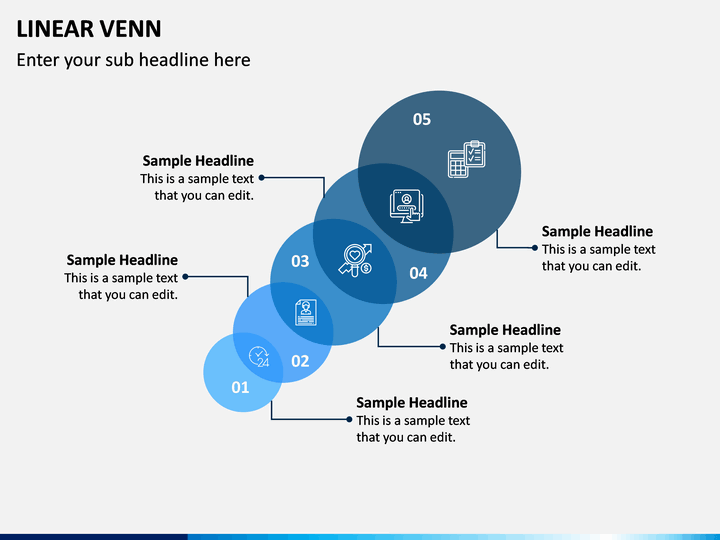
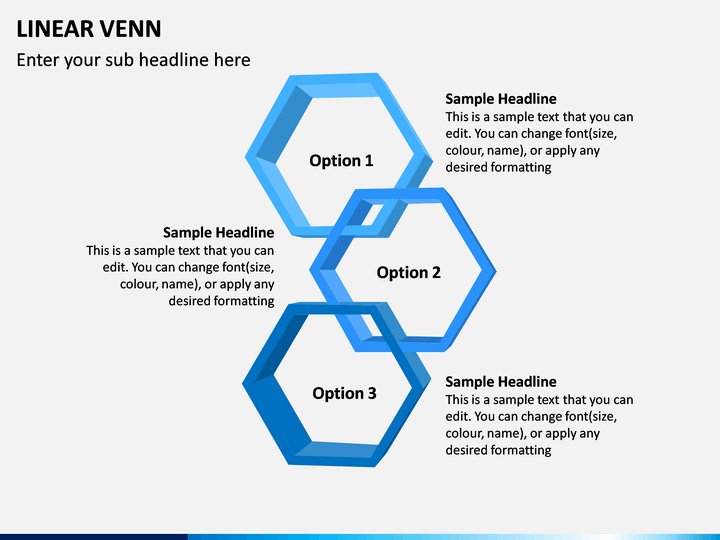
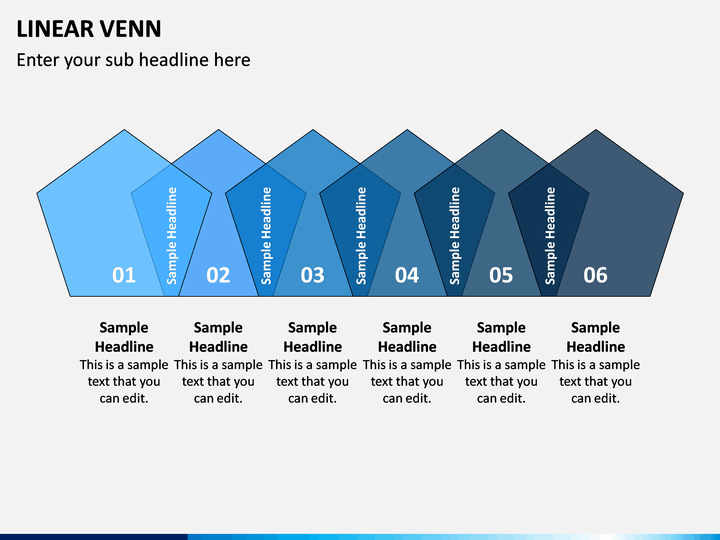
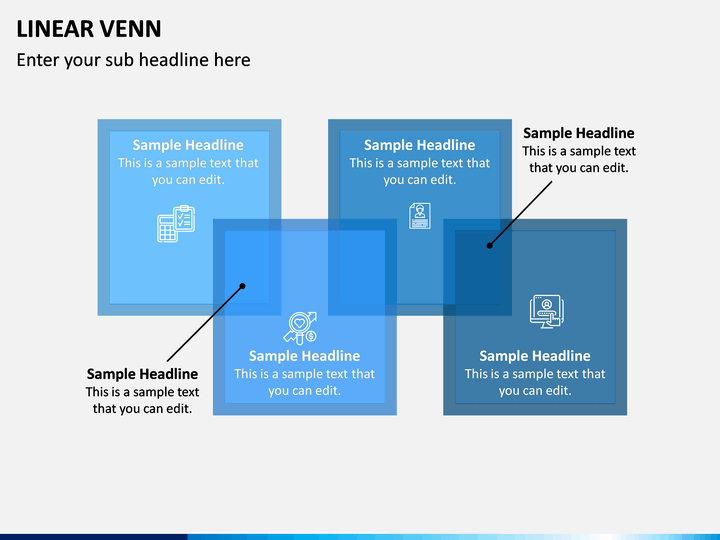
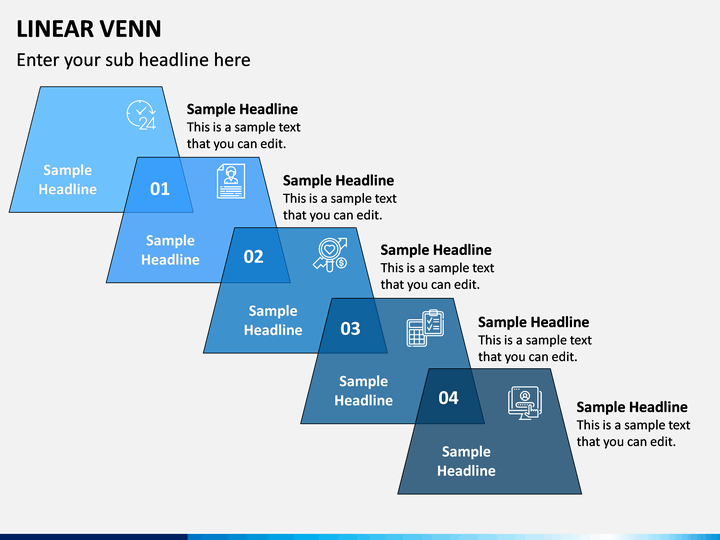
A Linear Venn diagram is a design that shows a relationship in a sequence. It is a SmartArt graphic layout used to show overlapping relationships in a series.
Want to create a Linear Venn Diagram PowerPoint template, but running out of time? No worries. Here's a 100% editable template for you where you get an option to make changes. Now use the presentation without any prior experience or being an expert. The unique features make the template easy to use for everyone, whether you are a student, a professor, a senior executive of an organization , or team leader.
More About the Topic
The Venn diagrams have an advantage over regular graphics, i.e., although both can be used to denote mathematical figures. Additionally Venn diagrams can indicate and analyze the non-mathematical charts. Venn Diagrams can help you make your presentation visually impressive and easy to explain.
So, if you want your marketing team to know about the different market sectors that can prove beneficial for your business growth or want to guide your HR team to utilize the common skill sets of employers from different teams, in every such case, Venn diagrams will make it simple for you to explain your point better. What are you waiting for now? Download Linear Venn PPT right away and present your thoughts in a better way.
Special Features in the Template
These types of diagrams are the best visual aids for your presentation as they serve one of the most useful and effectively illustrative graphics organization tools, especially when you are comparing, contrasting, or bringing out relationships between two or more things, places, subjects, or people, and so on.
- The use of infographics, vector-based shapes, icons, and charts makes it more exciting and useful for any person in an organization whoever wants to show it.
- Our professional designers have completely designed it from scratch.
- Resize, reshape, rescale, or recolor any visual graphics. No matter how much you modify or scale, the quality of slides will remain the same.
- It can be easily used on MS PowerPoint, Apple Keynote, and Google Slides.
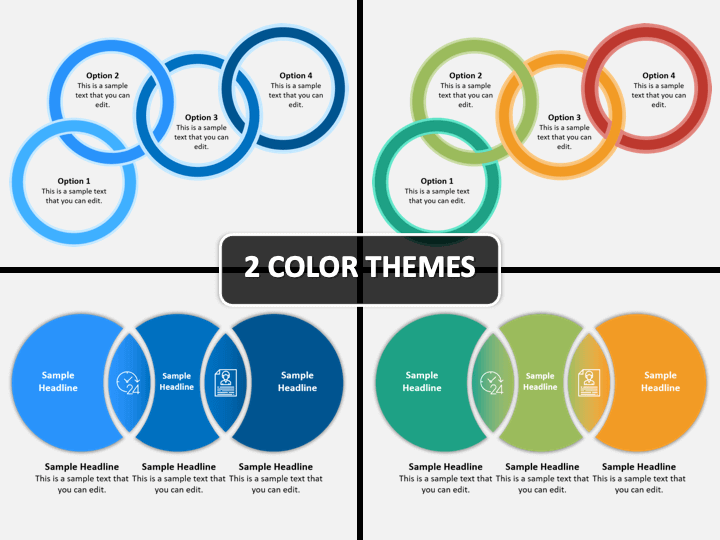
- It is available in two different themes: blue and multicolor. You can here choose the layout you wish and present it in your way.
- Separate files are provided for 4:3 (standard screen) and 16:9 (widescreen) layouts.
Write Your Own Review

Related Products


