

Matrix 5x9 for PowerPoint and Google Slides
Matrix 5x9 for PowerPoint and Google Slides
(1 Editable Slide)
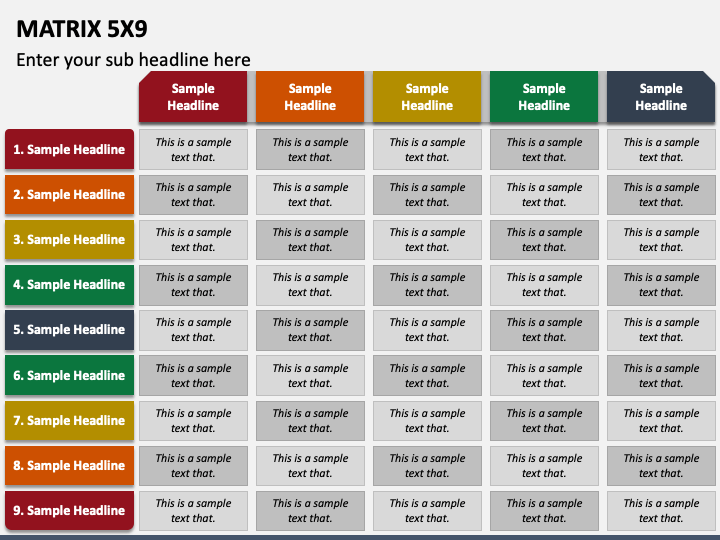
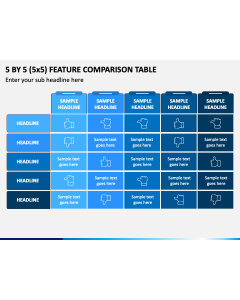
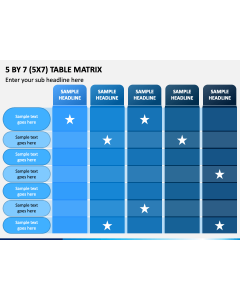
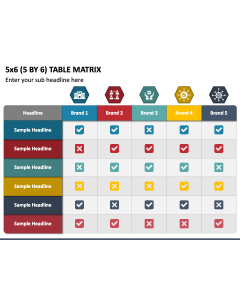
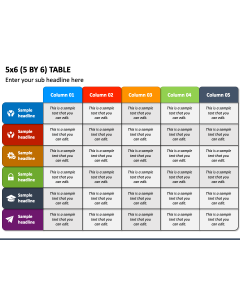
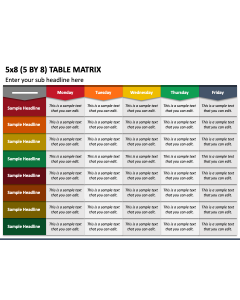
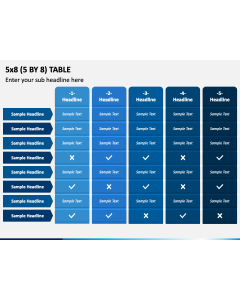
Use our Matrix 5x9 presentation graphic for PowerPoint and Google Slides to present a wide range of information in a structured and visually appealing format. The slide features a tabular infographic comprising five columns and nine rows. Project managers can leverage this graphic to represent the tasks of a project, categorized by priority, status, deadline, accountable person, etc. HR managers and team leaders can use this infographic to showcase the performance of different employees based on criteria such as productivity, efficiency, quality, and teamwork. Market analysts can visualize market trends and a comparative overview of data, such as sales figures, market share, customer demographics, etc.
Further, many more concepts, like product comparison, course curriculum, and more, can be showcased clearly and concisely.
Captivating Features
- You can quickly resize and recolor the graphic without encountering restrictions or challenges.
- The graphic will ensure uninterrupted quality on all screen sizes.
- No user will experience copyright issues, as the illustration has been meticulously designed.
- Our customer support executives are available 24/7 to resolve any queries you may have.
Give your presentations a creative edge by leveraging this stunning infographic; download it now!