


Similar Products
- Sale

- Sale
- Sale

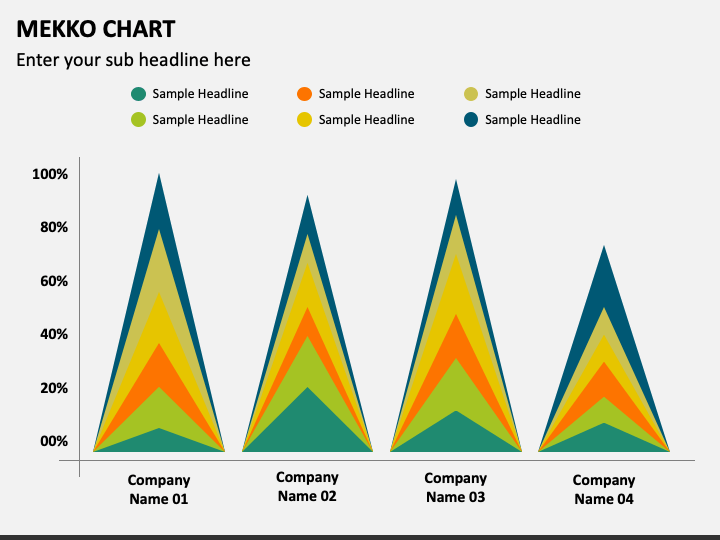
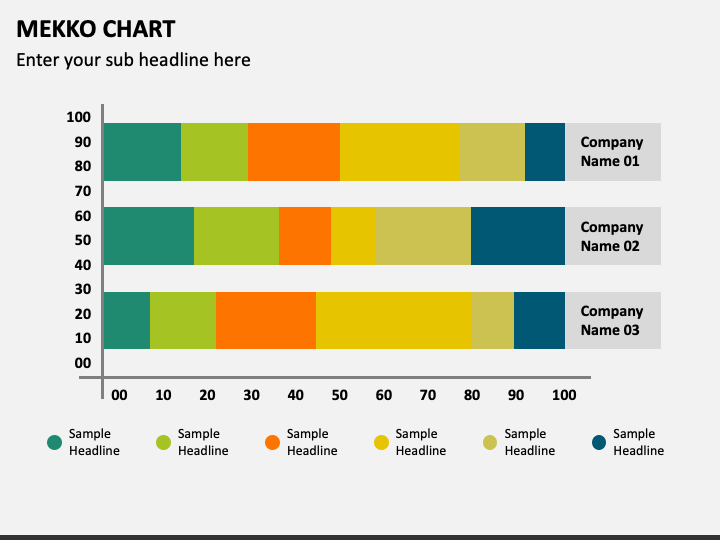
Get your hands on our Mekko Chart PowerPoint and Google Slides template to portray the distribution and relationships of variables within a dataset. You can further explain how these charts help make plans and decisions. Market analysts can leverage the visuals to present the market share and growth rates of multiple companies or products within different segments or regions. Sales experts can also use these graphics in their presentations to showcase revenue or sales breakdown by product, customer segment, or geographical area.
The slides feature colorful Mekko chart infographics that will help presenters visualize the information and data in a clear and concise manner.
Features at a Glance
- Regardless of technical know-how, all users can alter the deck elements without encountering restrictions.
- You can scale the graphics on any screen size without fretting about the resolution.
- The entire set has been carefully designed to avoid copyright violation issues.
Enhance the visual appeal of your textual content by downloading this feature-rich PPT!
Write Your Own Review

Related Products


