

Odisha Foundation Day Presentation - Free Download
Odisha Foundation Day Presentation - Free Download
(15 Editable Slides)
Related Presentation Templates


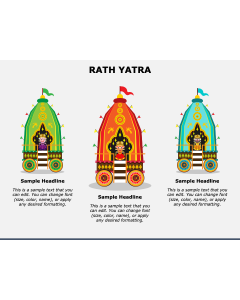

Odisha Foundation Day, also known as Utkala Dibasa (Utkal Diwas), is celebrated on April 1st every year. It marks the formation of the modern-day state of Odisha in India after disassociating itself from Bihar and Bengal. On this day, various cultural and historical celebrations occur in the state to commemorate its accomplishments and challenges to achieve a separate legal entity. People recognize the occasion with multiple cultural events, programs, and activities that showcase the rich heritage and traditions of the state. The day also provides an opportunity to honor Odisha’s cultural identity, history, and progress.
Lay your hands on our Odisha Foundation Day template for PowerPoint and Google Slides to display more intricacies of this state and its separation journey. The serene background, captivating graphics, stunning icons, and elegant typography make the slides ideal for adding a touch of dynamism to the presentations.
What’s Inside the Deck?
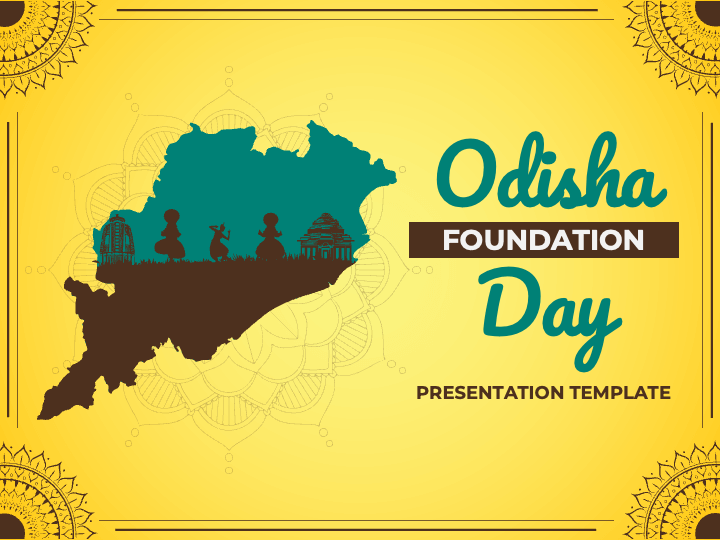
- A beautiful cover slide is provided to help you make your presentation’s beginning impactful.
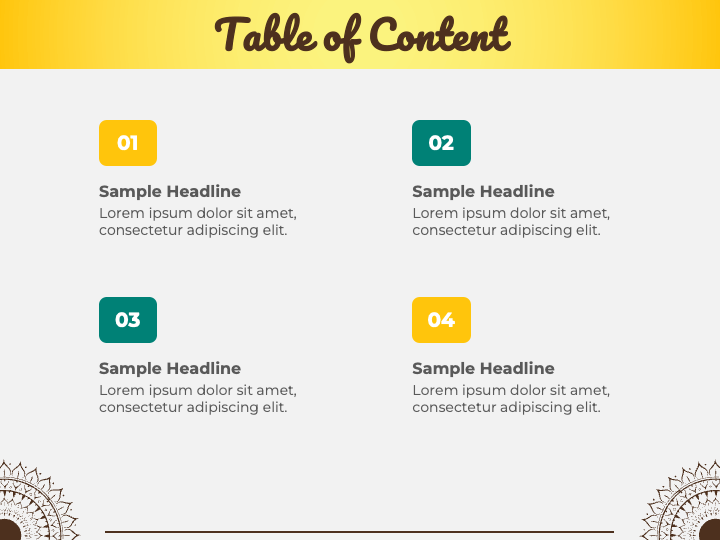
- Showcase your presentation’s agenda with the Table of Contents format.
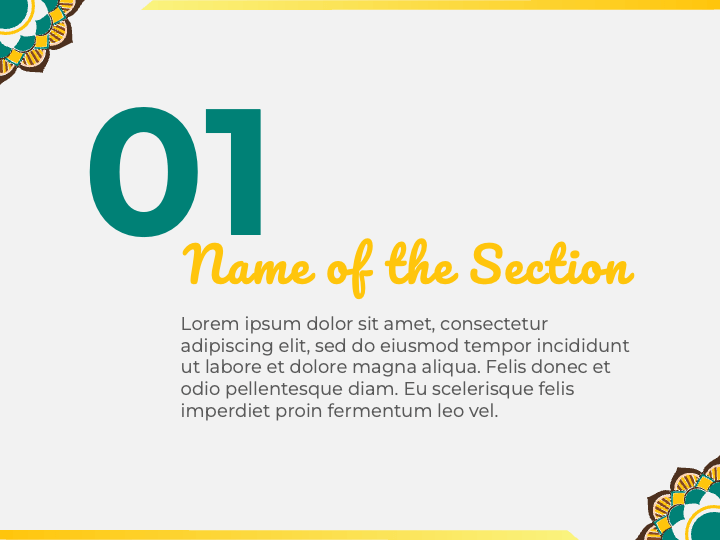
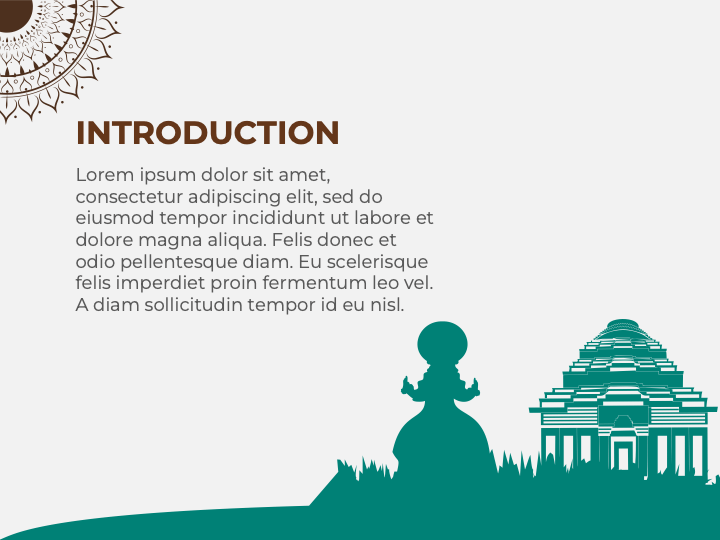
- Present a brief introduction of your topic via a compelling layout.
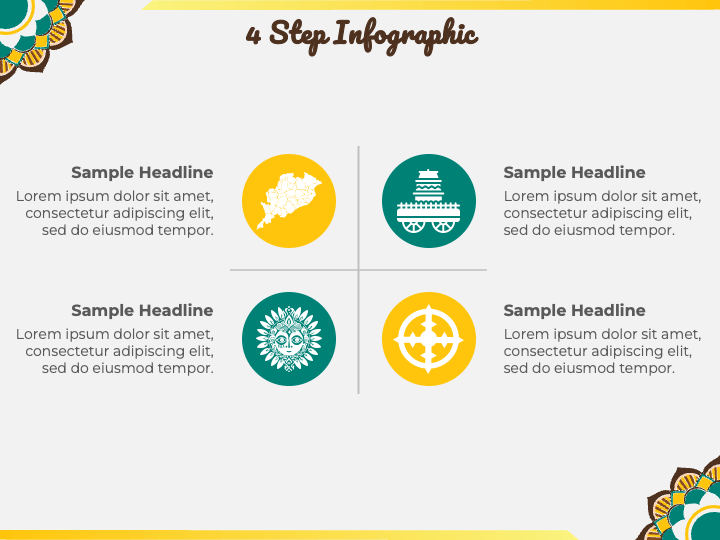
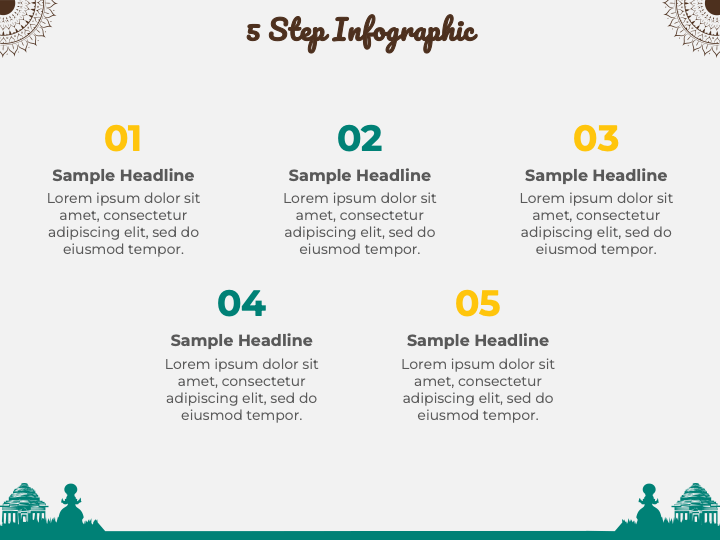
- Multi-step infographics can be used to highlight significant events that contributed to the state’s formation, prominent figures of diverse movements, and more.
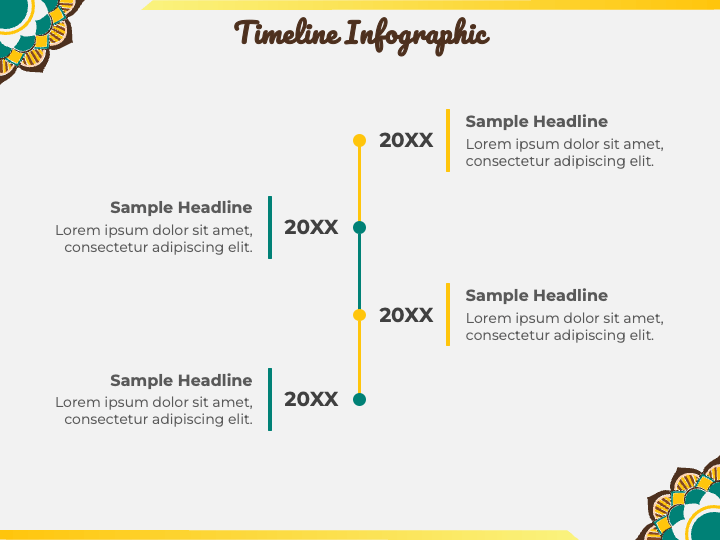
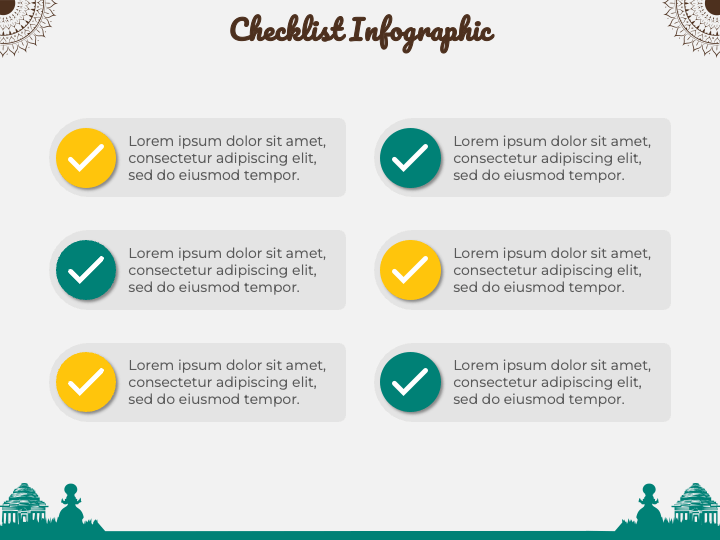
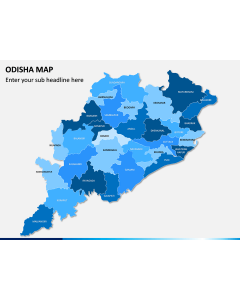
- Illustrate the state’s historical milestones, cultural heritage, geographical features, etc., via a checklist infographic.
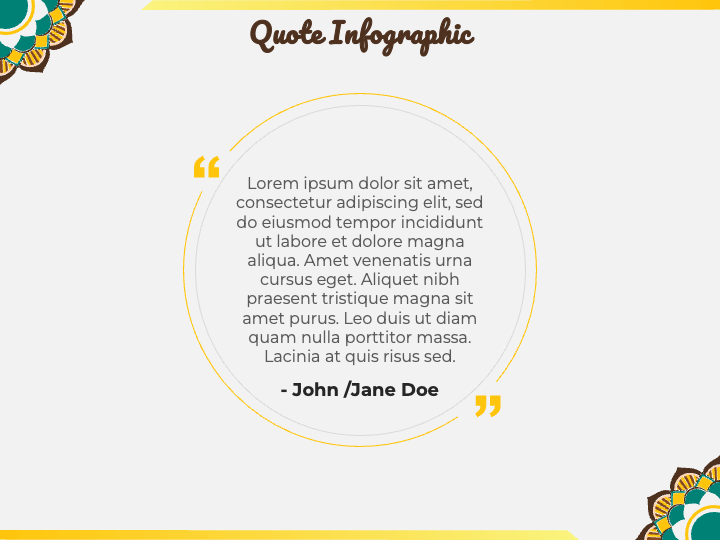
- Portray a great saying about the state via a quote infographic.
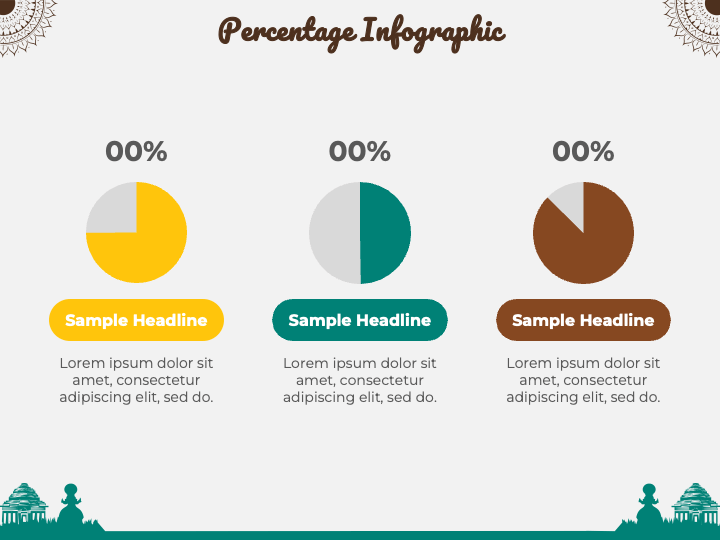
- Showcase the population distribution across different regions or districts of Odisha, the percentage of various cultural communities, the religious diversity, and more through pie charts.
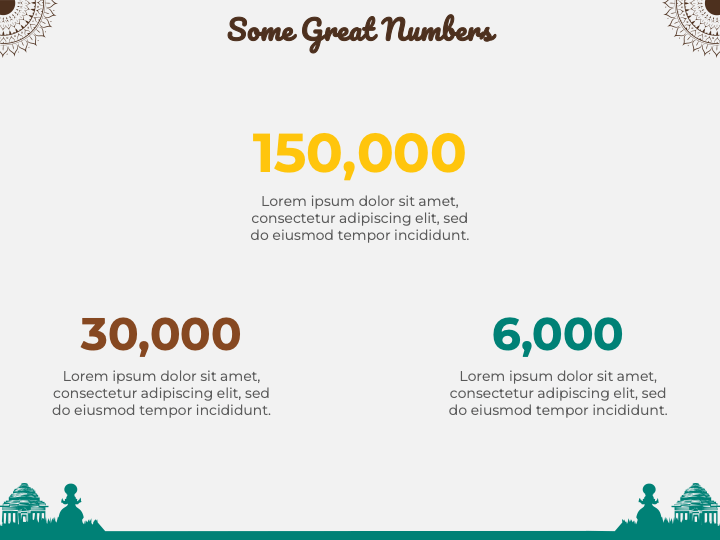
- Present the state’s population, economic indicators, literacy rate, etc., via a stats layout.
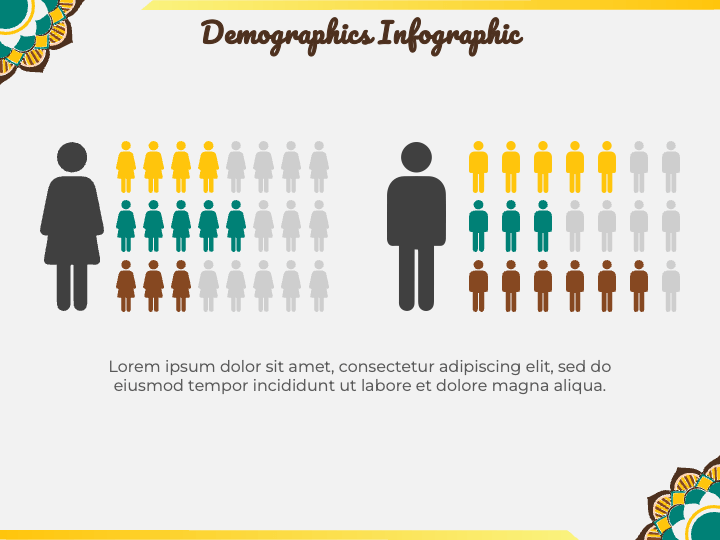
- Highlight the percentage of the population in different age groups, gender ratio, urban vs. rural population, and more via a demographics infographic.
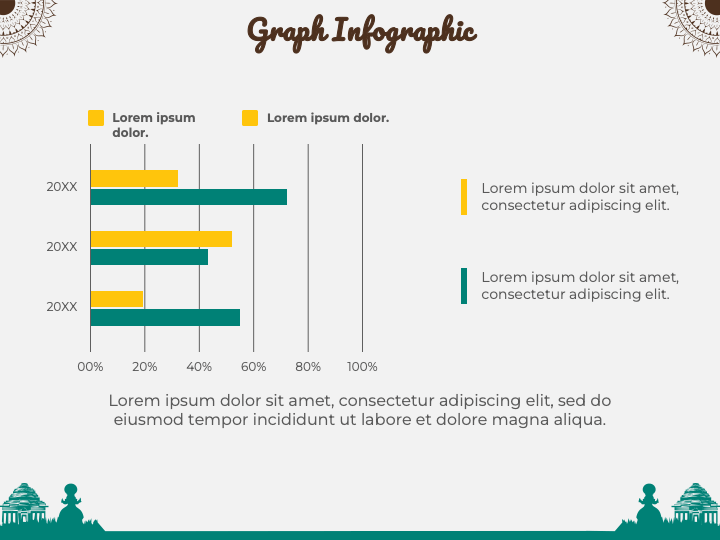
- With the bar graph, you can illustrate the population growth over the years, the contribution of different sectors to the state’s economy, the infant mortality rate, and more.
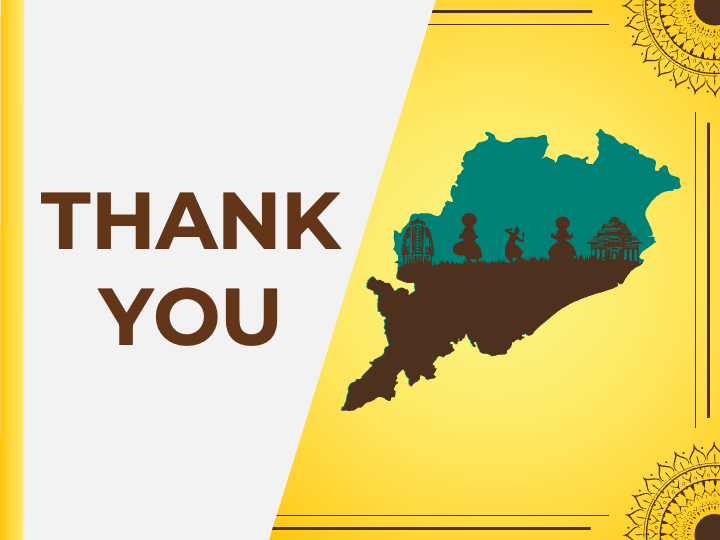
- Present your appreciation for the audience’s sincere attention with our ‘Thank You’ note.
Features
- You can alter and adjust the deck components according to your preferences without a fuss.
- All design elements will render the same quality and clarity on all screen dimensions.
- Our skillful designers have considered all copyright laws and regulations while designing this set to avoid issues.
Grab this PPT immediately!