


Similar Products
- Sale

- Sale
-
-
- Sale
- Sale


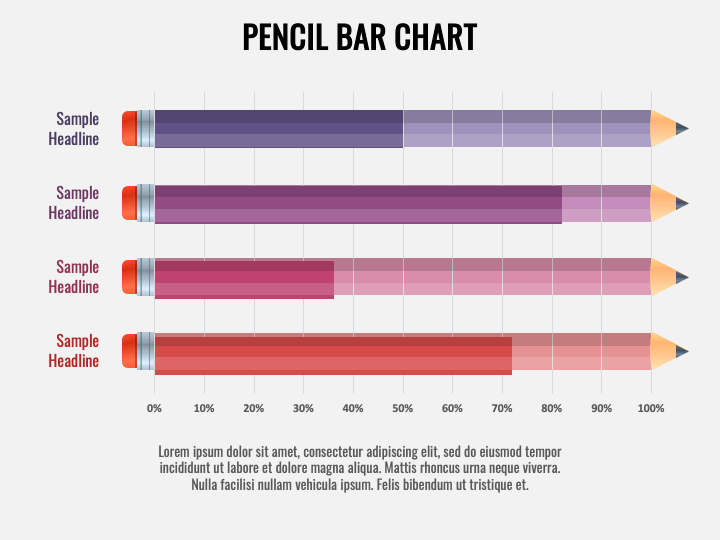
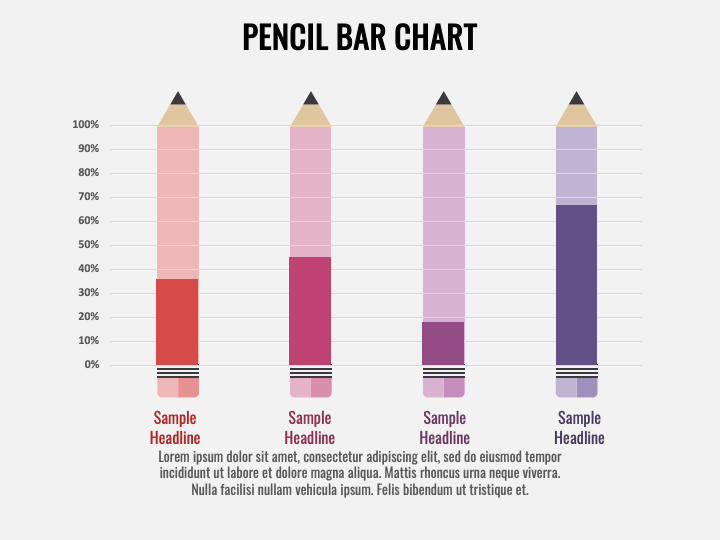
We have introduced the Pencil Bar Chart template for PowerPoint and Google Slides to help you give your presentations a creative makeover and simplify complex data for the audience. Sales professionals can leverage this multipurpose PPT to showcase the comparison of sales figures, revenue, market share, top-selling products, etc. TV broadcasters can use the visuals to highlight the time-based data, like most viewed TV channels and peak viewership times. The graphics are also perfect for depicting survey results, demographic data, and more.
The slides comprise pencil bar chart infographics adorned with subtle color contrasts. Each layout is accompanied by ample space for text insertion. You can use these charts to add a zing of creativity to your presentations.
Features
- The deck elements can be customized with the minimum time or effort invested.
- Each visual can be scaled to any extent without compromising clarity or quality.
- The set attributes are designed from scratch to ensure no room for copyright issues.
- Our support staff is accessible around-the-clock for a quick turnaround to your queries.
Write Your Own Review

Related Products


