

Ranking Infographics for PowerPoint and Google Slides
Ranking Infographics for PowerPoint and Google Slides
(9 Editable Slides)


Related Presentation Templates


Download our Ranking Infographics for PowerPoint and Google Slides to showcase rankings in various settings. Market analysts can use these illustrations in their presentations to illustrate the companies’ market position based on market share, customer base, product range, and more. Marketers can display product performance rankings based on customer reviews, quality, and popularity. Sales professionals can display rankings of products based on sales figures, customer satisfaction levels, or product success rates. HR managers can use this deck to highlight employees’ rankings based on their performances. With this versatile template, you can highlight academic achievements like top-performing schools, colleges, or students. Researchers can visualize rankings of countries based on various parameters, such as population, literacy rate, GDP, and more.
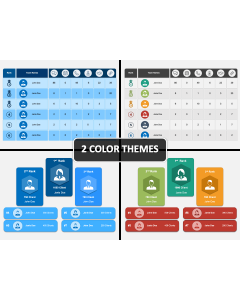
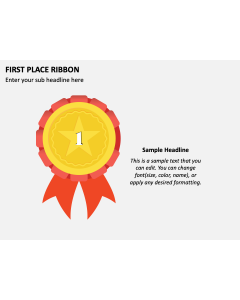
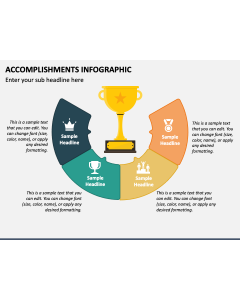
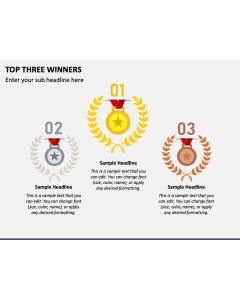
The slides comprise various eye-pleasing designs, including golden, silver, and bronze trophies, medals, ribbon badges, a table, and more. The visuals are adorned with appealing icons and a vivid color scheme to draw your audience’s attention. Each graphic provides ample space to put your desired textual information in an organized manner.
Features
- You can conveniently alter the graphics to match your presentation’s theme.
- Each graphic ensures the same quality and resolution, regardless of screen size.
- All attributes are crafted after thorough research to leave no room for issues related to copyright breach incidents.
Get this PPT to infuse a creative flair into your presentations!