

Real Estate Cycle Diagram for PowerPoint and Google Slides
Real Estate Cycle Diagram for PowerPoint and Google Slides
(2 Editable Slides)
Related Presentation Templates

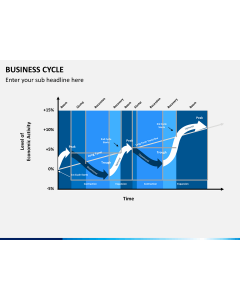


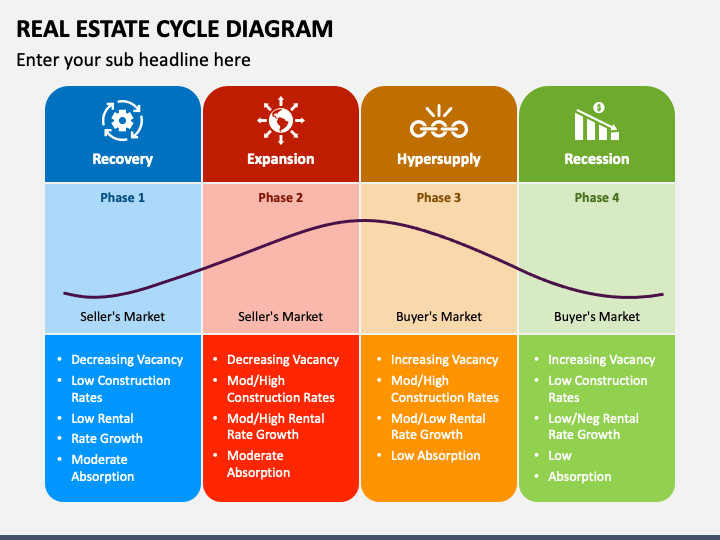
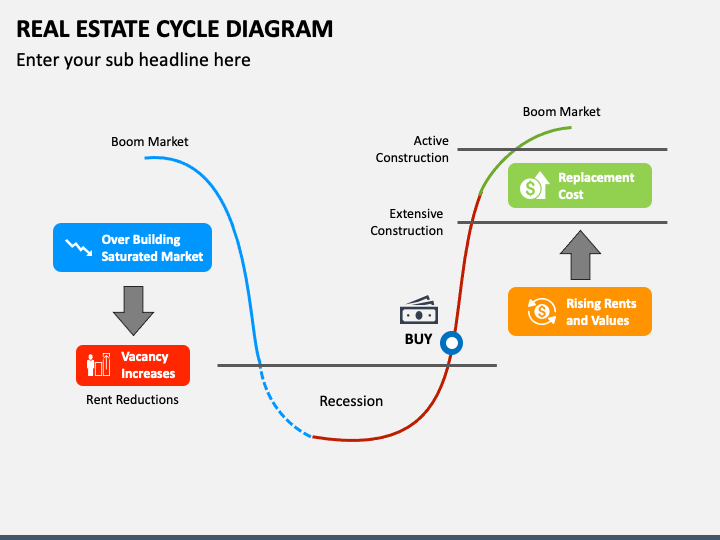
Use our Real Estate Cycle Diagram PowerPoint template and Google Slides theme to depict the key facts about the real estate market phases and how to determine the best time to enter and exit the market. Real estate agents can leverage this well-thought-out deck to showcase tips to effectively tackle boom or bust in the real estate market and identify investment opportunities and risks that can arise on the verge of phase transition. You can also make the most of this set to highlight the appropriate investment and exit strategies for each phase.
The slides comprising graph infographics demonstrate the phases of the real estate cycle. You can leverage these graphics to visualize the duration of this entire cycle, factors affecting this cycle, etc. The visuals are also adorned with appealing icons and subtle color combinations to help presenters uplift their presentations to maximize audience engagement.
Excellent Features
- You can customize the deck elements in just a few clicks.
- Each graphic is designed in high resolution to ensure they look the same on all screens.
- Download this PPT once and use it for a lifetime without encountering challenges.
- Get a quick turnaround to your queries from our 24*7 available customer support executives.
Get this graphic-rich set now to spruce up your presentations!