
Result Comparison PowerPoint and Google Slides Template
(5 Editable Slides)

Result Comparison PowerPoint and Google Slides Template

SB16725
Available For


Use our Result Comparison template for PowerPoint and Google Slides to showcase statistical data of research, surveys, etc., in a visually impressive manner. Market analysts and product managers can use this versatile deck to illustrate the effectiveness of products or services based on sales figures, customer satisfaction, and other relevant metrics. Project managers can depict differences in project outcomes across different phases. Financial experts can showcase a company’s financial performance comparison, such as revenue, profit margins, and expenses in different quarters or years.
HR managers and team leaders can illustrate the comparison of individual and team performance based on KPIs (key performance indicators) like productivity, sales targets, or project completion rates. Educators and school administrators can display student performance in different subjects, highlighting areas for improvement. Further, you can leverage this set to highlight the comparison of website traffic, the environmental impact of different practices, technology adoption rates, and more.
A Glance at the Slides’ Design
- A captivating cover slide is provided to help you elevate your presentation’s beginning.
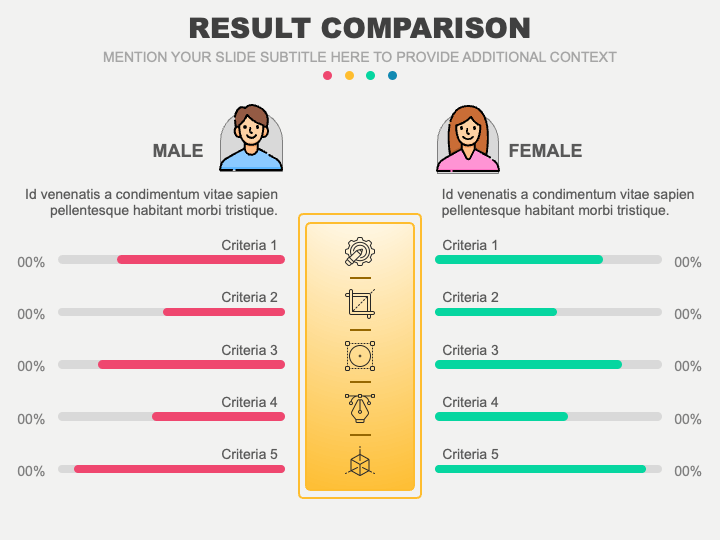
- A comparison diagram with a male and female icon can be used to depict the product’s popularity and usage among male and female customers.
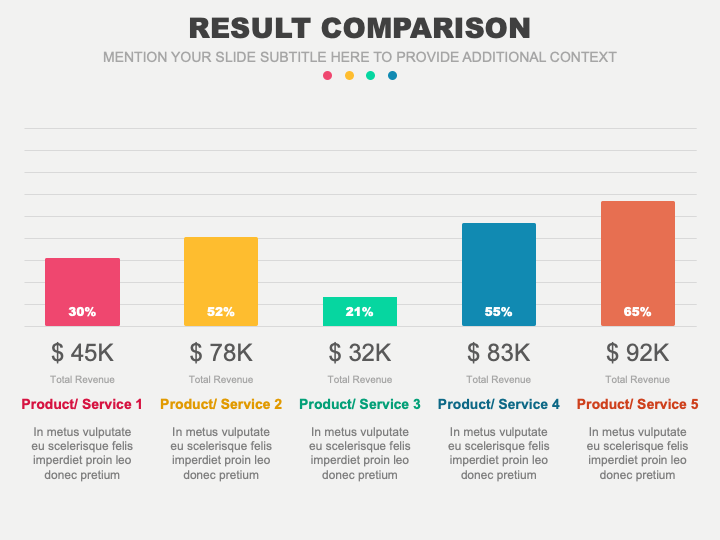
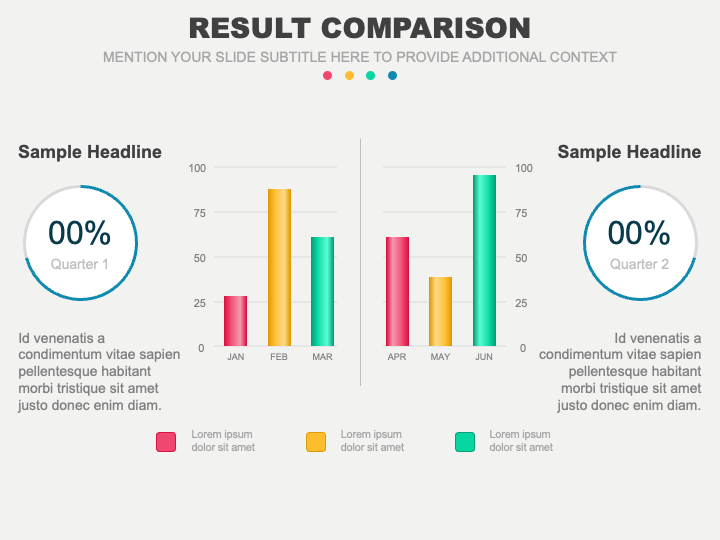
- The difference in performance, demand, and sales of various products and services can be illustrated via bar graphs.
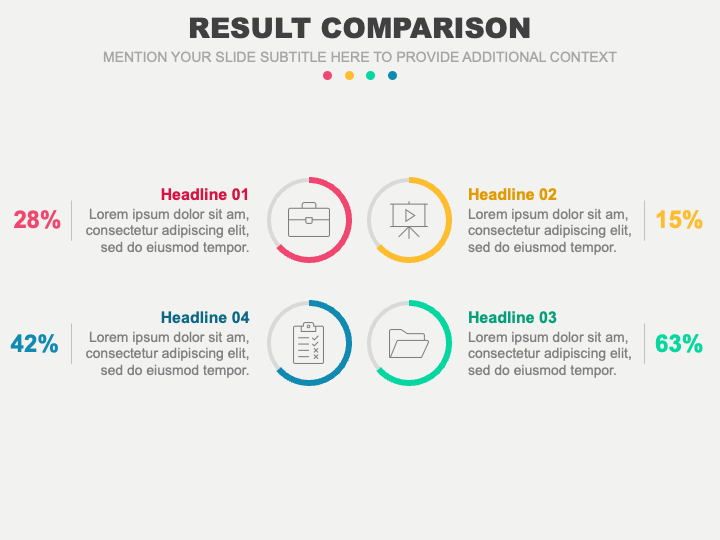
- Various campaigns’ efficiency and effectiveness can be showcased via donut charts.
Features
- Fuss-free editing
- High-resolution graphics
- 24/7 customer support
- Copyright-free
Download this PPT immediately!
Write Your Own Review

Related Products


