

Time Infographics for PowerPoint and Google Slides
Time Infographics for PowerPoint and Google Slides
(7 Editable Slides)
Related Presentation Templates

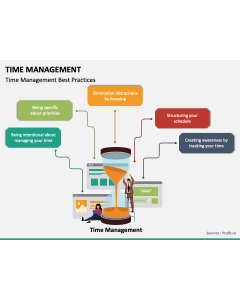
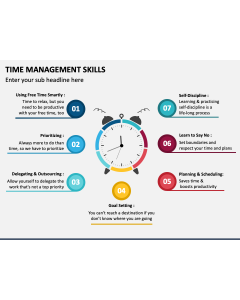
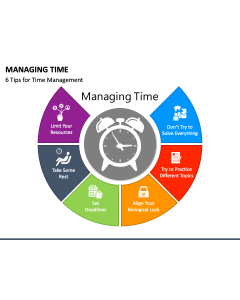
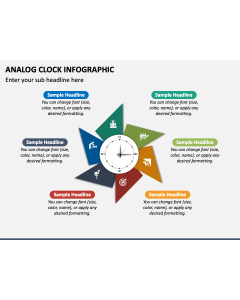
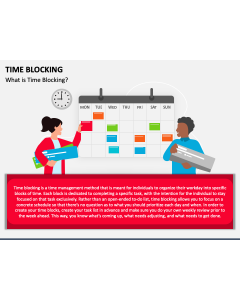
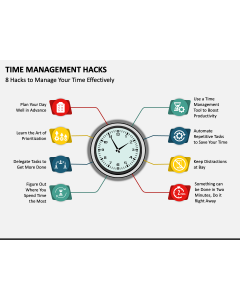
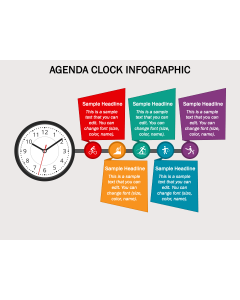
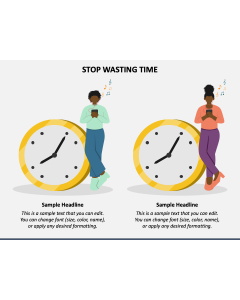
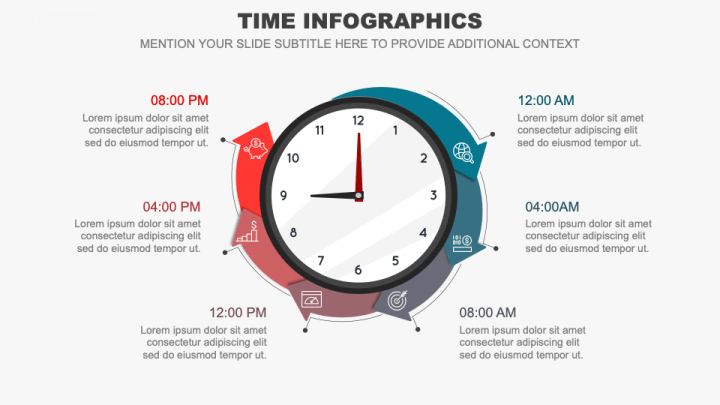
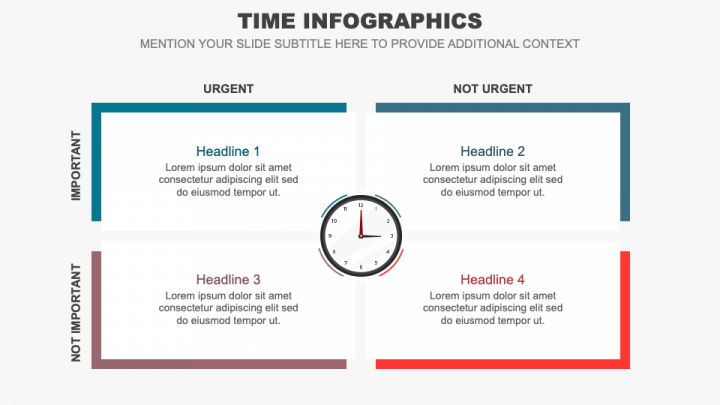
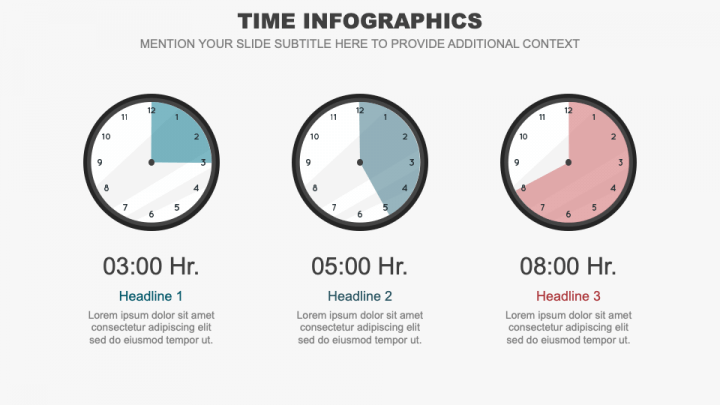
Download our Time Infographics for PowerPoint and Google Slides to illustrate a wide range of topics over time in a visually engaging and structured manner. Business professionals can use this set to visualize the company’s growth trajectory, key milestones, product launches, mergers and acquisitions, and more. Project managers can use versatile illustrations to communicate project schedules, phases, and deadlines to employees. Team leaders can portray the to-do list based on priority before team members. Marketers can use this template to display the timings for posting different types of content on various platforms. Market analysts can use this feature-rich deck to showcase the shift in market trends, industry growth, and technological advancements over time. Career coaches can present strategies for improving time management at work, showing how efficient time use can lead to a healthier work-life balance, heightened motivation, increased focus, and more free time. School administrators can depict the schedule and learning outcomes of new courses and programs. Educators can highlight the significant events in history and their impact.
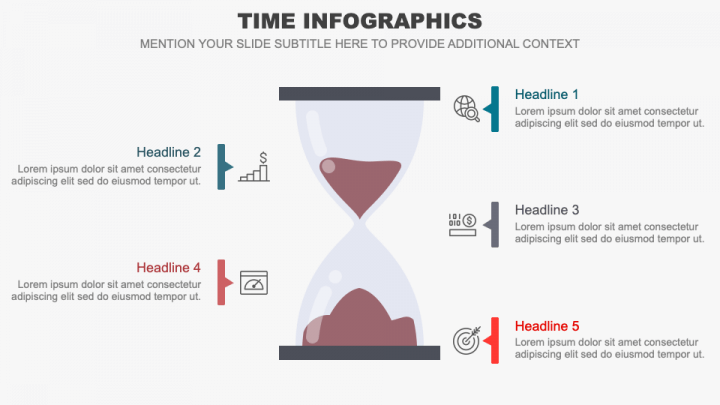
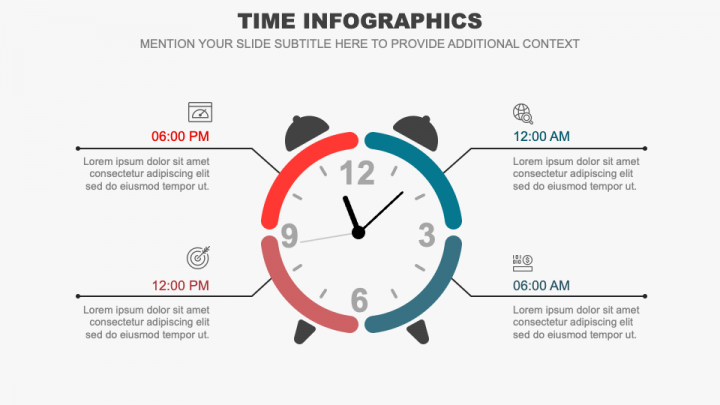
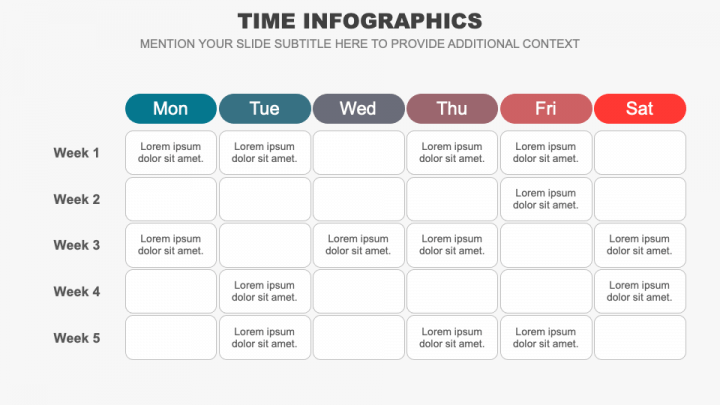
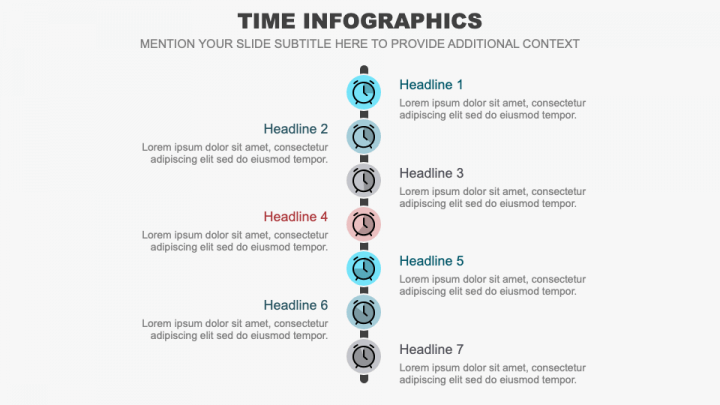
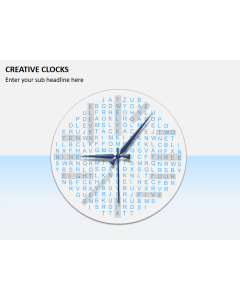
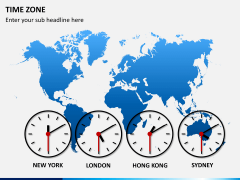
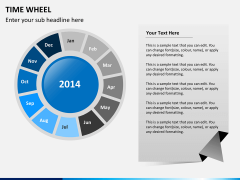
The slides boast high-definition visuals of alarm clocks, wall clocks, a sand timer, a table matrix, a timeline, etc. Thoughtfully selected icons and color contrast will assist you in adding meaning to your content. The editable textual boxes are provided for the preferred text insertion.
Features
- Hassle-free editing
- 24/7 customer support
- Free from copyright concerns
- Lifetime access
- High-quality graphics
Get this PPT now to boost your presentation’s overall aesthetics!