

Venn Diagram - 5 Circles
Venn Diagram - 5 Circles
(1 Editable Slide)
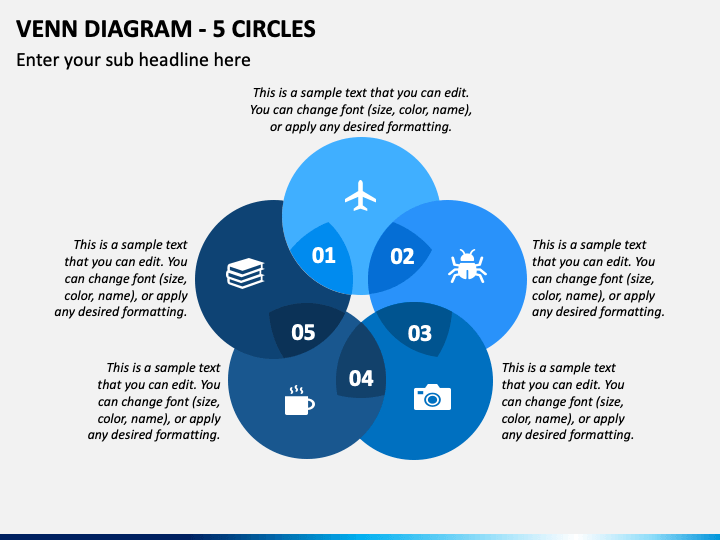
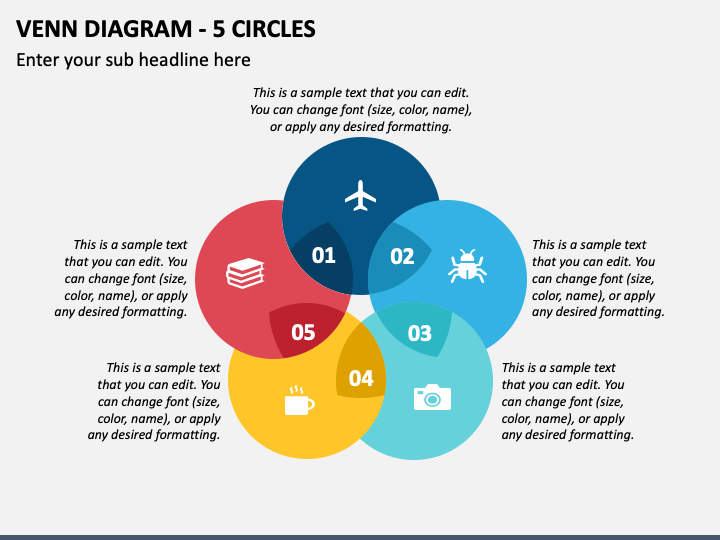
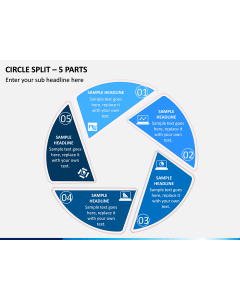
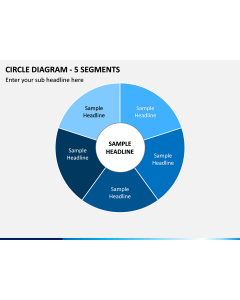
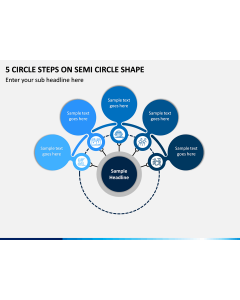

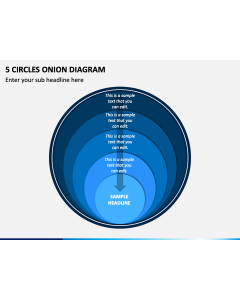

Use our Venn Diagram - 5 Circles slide for Microsoft PowerPoint and Google Slides to strengthen your presentations visually. It is a valuable visual resource for marketing managers who can use it to portray the analysis of various market segments. Product managers can use this vector to showcase competitive analysis, differences and similarities of products and services of a brand, etc. Sales professionals can highlight the analysis of customer preferences and the effectiveness of sales strategies.
The PPT slide depicts an infographic of five overlapping circles. Each circle has been incorporated with a spectacular icon, a striking color background, and customizable text placeholders for adding more content. Download this slide today!
About the Features
- Our adept customer care team is available 24/7 to help you with your queries or doubts.
- You can easily modify the visual color and size without technical experience or editing knowledge.
- Exceptional resolution and optical quality on different screen sizes are assured.