

Fishbone Diagram PowerPoint and Google Slides Template
Fishbone Diagram PowerPoint and Google Slides Template
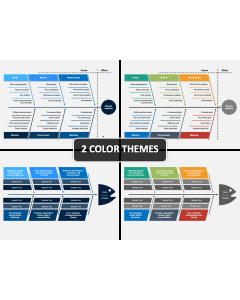
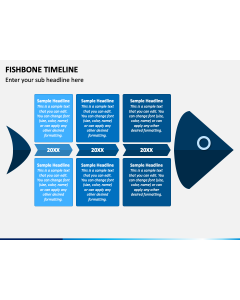
(12 Editable Slides)

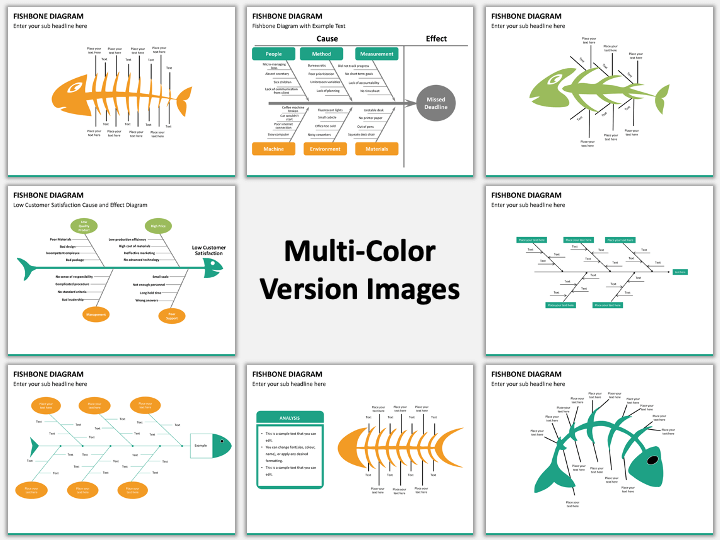
(12 Editable Slides)
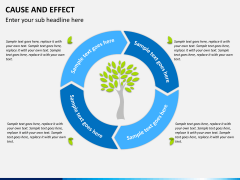
Related Presentation Templates
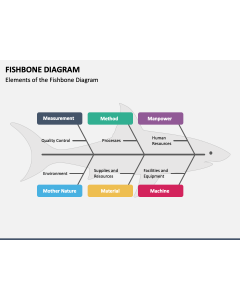

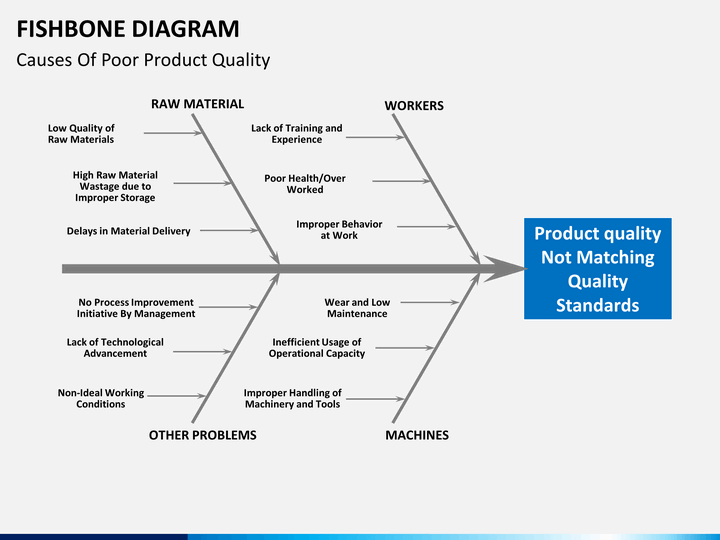
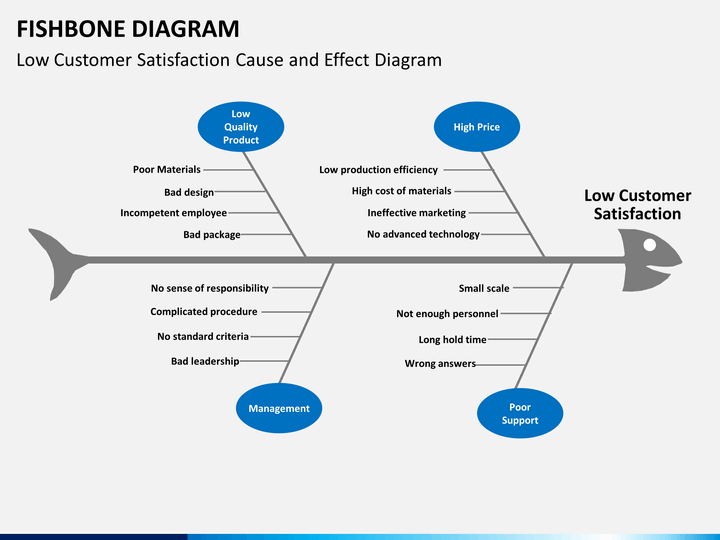
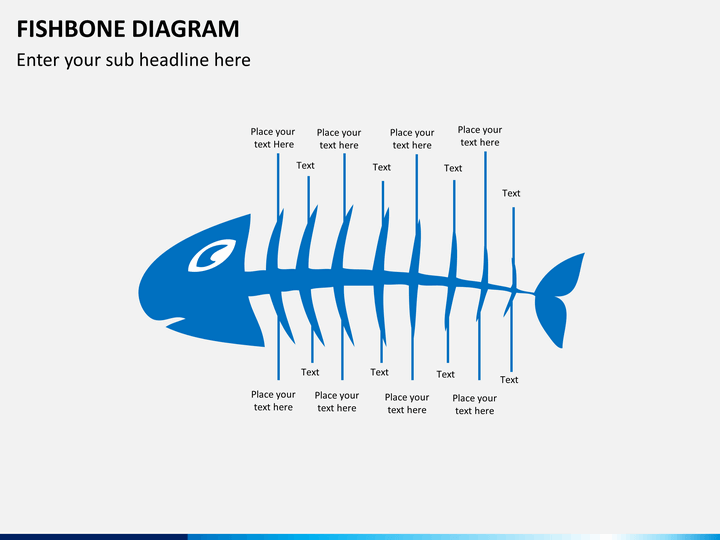
Fishbone diagrams are used as a tool to identify the problems and their outcomes, you may use it while locating where the shortcomings are actually present - is it the production plant, the underlying technology, the equipment or machinery used, the people on staff, or the procedure that is followed in the process.
Whether your area of working deals with finance & insurance; marketing & advertising; manufacturing & processing; or you represent aviation, publication, health or hospitality, whatever might be your sector but defects can always turn up in your way, which you will need to discuss with your team or sometimes with the entire workforce. In such discussions, problem solving, and brainstorming sessions, presentations form an inseparable part.
Now, when the main motive is to reach your audiences with your idea and communicate some important message to them, creating visual aids for the purpose may appear as a burdensome activity, especially when you are in short of time with various other tasks on your to-do-list. With a fully-editable pre-designed Fishbone Diagram PowerPoint template, you will simply have to make a few necessary changes with the fonts, colors, background and a little modification of the design elements, that's all. You’ll be ready with just the kind of visuals that you want to make your point clear.
With numerous slides to choose from and complete designing flexibility and easier option to add, remove, and modify content onto your visuals, you get to present your ideas more clearly and confidently. So, go ahead and get ready with what you got to speak and stop worrying about the visuals anymore!
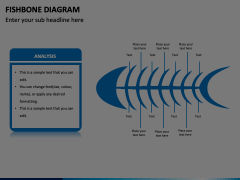
About Fishbone Diagram
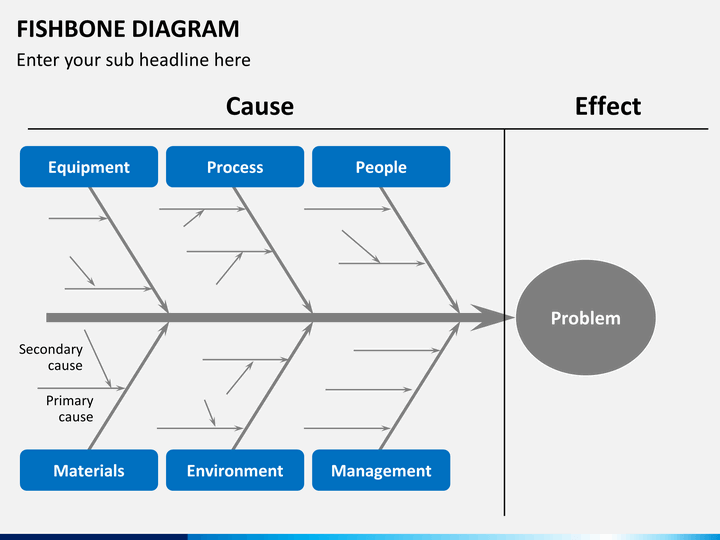
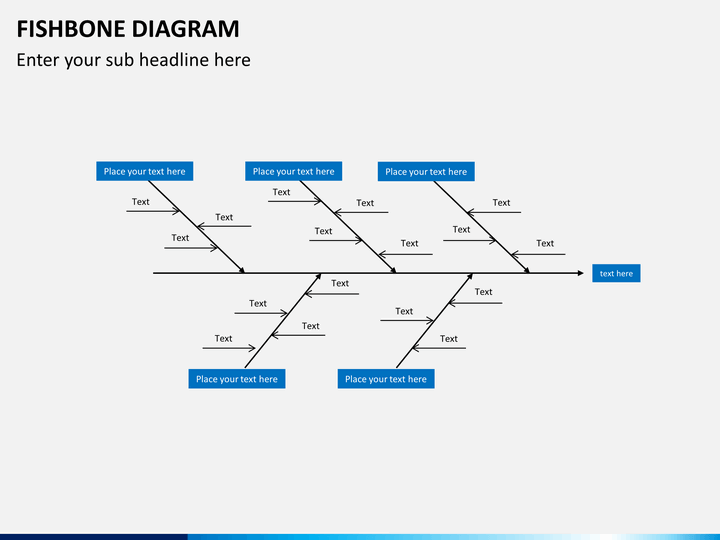
Used as a cause-and-effect tool, Fishbone Diagram is an effective way to explain the relation between causes and their effects, it was originally developed as a Quality Control technique by Professor Kaoru Ishikawa, a Quality Management pioneer, way back in 1968; it found a detailed mentioning in his book, "Introduction to Quality Control," in 1990.
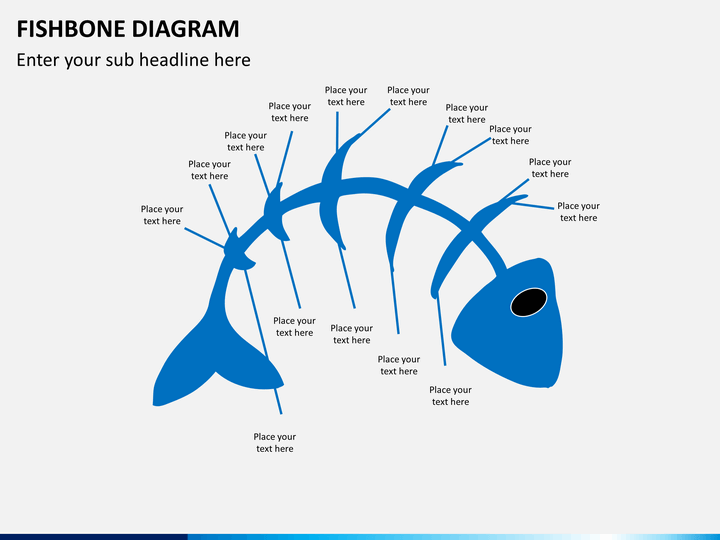
It is named after its appearance as the completed form of the diagram looks almost like the skeleton of a fish. The other names by which it is known include Ishikawa, Herringbone, and Fishikawa.
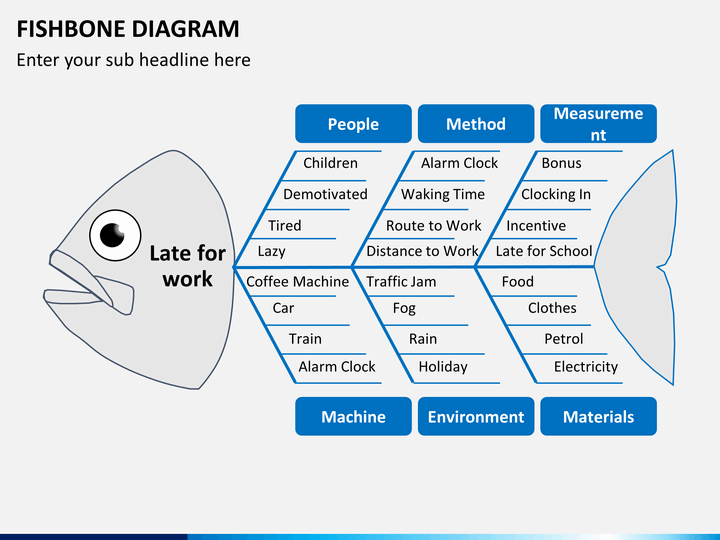
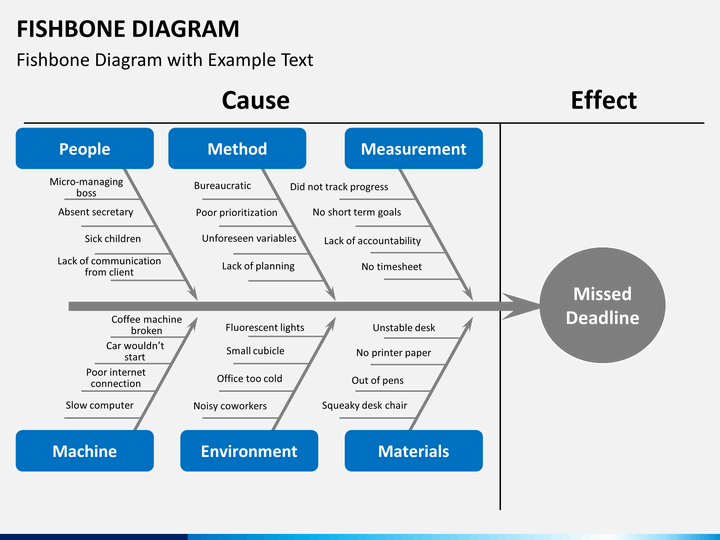
It is mainly used to identify and illustrate the reasons behind present defects and imperfections in the product design and quality as well as the factors that may result into the defects. Once the reasons are identified which are also considered as the sources of variation according to this framework, the next step is taken towards the prevention of defects and imperfections.
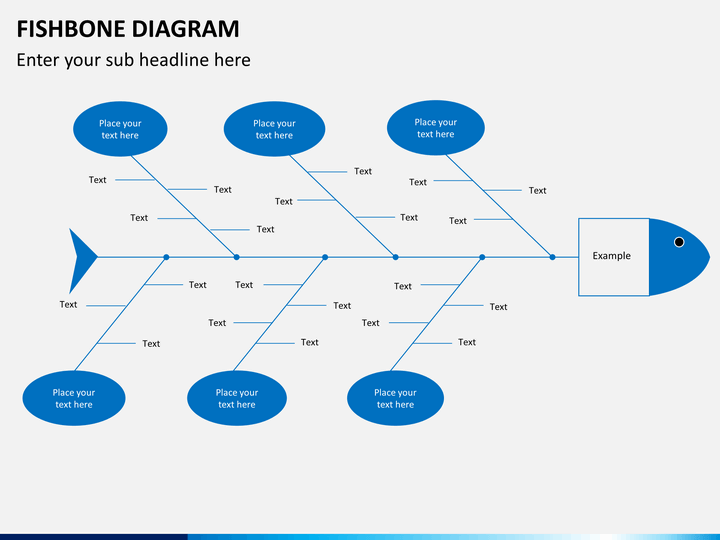
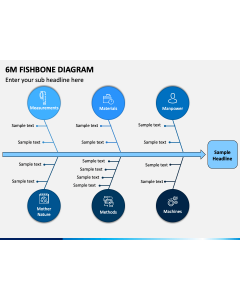
The diagram is usually used to illustrate 6Ms (machine, method, material, man power, measurement, milieu or Mother Nature) of the manufacturing industry, 7Ps (product/service, price, place, promotion, people/personnel, processes, physical evidence) of the marketing industry, or the 5Ss (samples, scheme, synchronous, skin, and search) of the service industry.