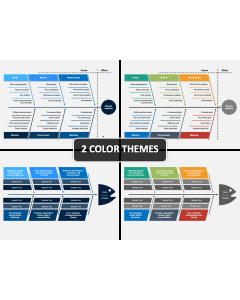
Fishbone Infographics for PowerPoint and Google Slides
Fishbone Infographics for PowerPoint and Google Slides
(7 Editable Slides)
Download our Fishbone Infographics for PowerPoint and Google Slides to display complex textual information in an easy-to-comprehend manner. Project managers can use these illustrations to visually represent the potential causes of project delays, budget overruns, or quality issues. Manufacturing engineers can showcase how identifying failures in equipment or defects in manufacturing processes aids in informed decision-making related to equipment maintenance, process optimization, and quality control initiatives.
Quality assurance professionals can leverage these graphics to illustrate underlying factors contributing to product and process defects, errors, or failures. Healthcare professionals can portray the root causes of medical errors, patient safety incidents, or healthcare-associated infections. Additionally, you can depict how fishbone infographics serve as powerful visual aids for problem analysis, decision-making, and risk management across various industries and disciplines.
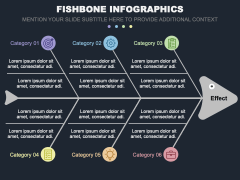
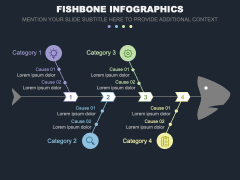
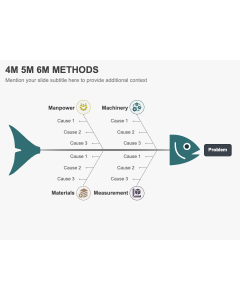
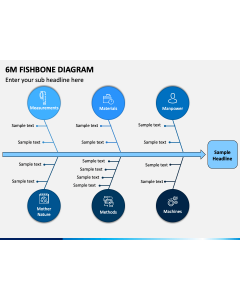
The slides feature various fishbone diagrams. Editable textual boxes paired with visuals make the slides versatile and allow presenters to put their desired content.
Features
- You can tailor the deck elements to suit your preferences effortlessly.
- All visuals guarantee the same resolution, irrespective of screen size.
- Each attribute has been carefully designed to eliminate the room for issues related to copyright issues.
Grab this PPT to deliver a stylish yet informative presentation!
