10 Columns Table
10 Columns Table
(1 Editable Slide)
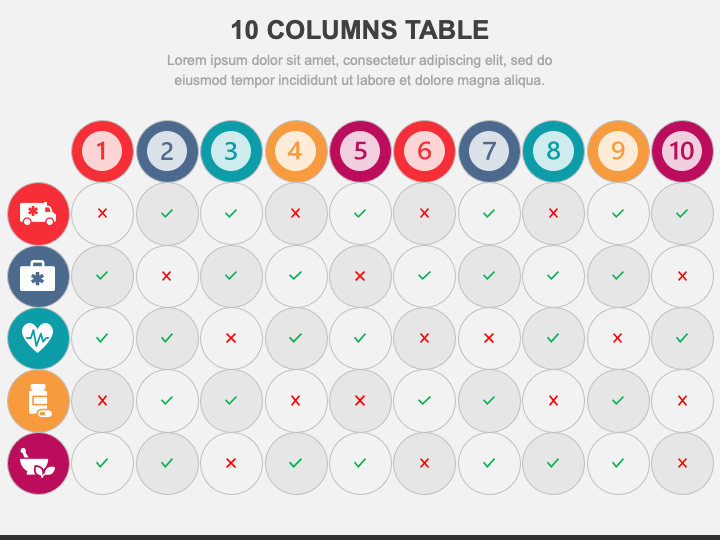


Grab our 10 Columns Table slide for PowerPoint and Google Slides to give your textual information a visual perspective and ensure maximum comprehension. The slide features a tabular infographic with right and wrong check marks.
Market analysts can leverage this graphic to highlight an overview of favorable and unfavorable government policies, competitive forces, market conditions, consumer preferences, etc., for introducing a product or expanding a business. Project managers can showcase the status of different project activities and tasks. Sales professionals can illustrate an overview of the targets achieved and missed over a specific period by different salespeople.
Features
- Customizing the illustration according to your preferences is an effortless task.
- The graphic will maintain the same quality and clarity on screens of all sizes.
- Our designers have carefully designed the illustration to ensure it complies with copyright regulations.
Give your presentations a dynamic look with this PPT; download it now!