


Similar Products
- Sale

-
- Sale
- Sale
- Sale
- Sale


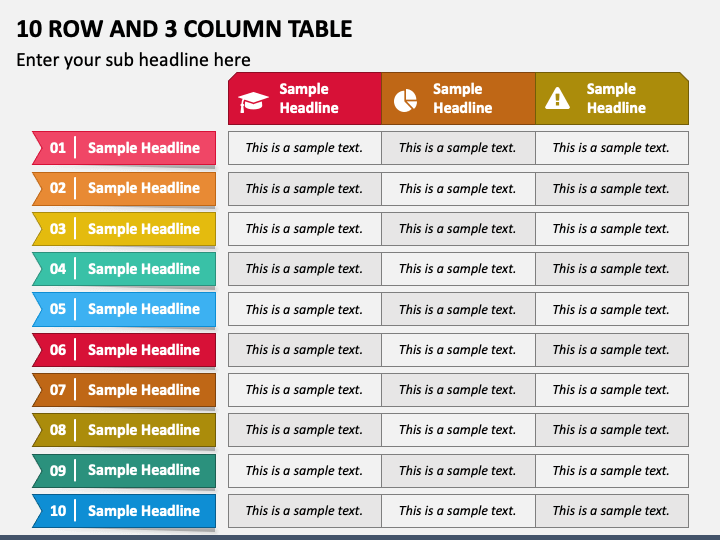
Our PowerPoint and Google Slides presentation graphic featuring 10 Row and 3 Column Table is the optimal choice for effectively presenting data and information in an orderly and coherent manner. The entirely editable cells in the tabular infographic allow for the easy insertion of text.
This versatile visual aid is ideal for displaying product features, comparisons, financial analyses, schedules, timelines, survey results, and more. Professionals from diverse industries can use this adaptable infographic in their presentations to suit their requirements.
Key Features
- You can easily customize the illustration to match your needs and preferences.
- Our team created the illustration after comprehensive research to avoid copyright infringements.
- Our customer service agents are available 24*7 to assist you with any concerns.
- You only need to download the PPT once to get its unlimited and unrestricted access for life.
Lay your hands on this multi-use infographic to provide meaningful insights from large data sets clearly and concisely!
Write Your Own Review

Related Products


