

3 Columns 9 Rows for PowerPoint and Google Slides
3 Columns 9 Rows for PowerPoint and Google Slides
(1 Editable Slide)
Product Details
(1 Editable Slide)
Available For
PowerPoint
Keynote
Google Slides
Canva Slides
Animation:
Yes
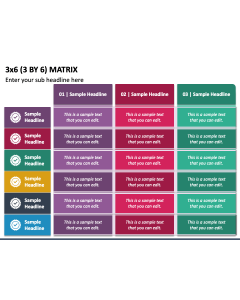


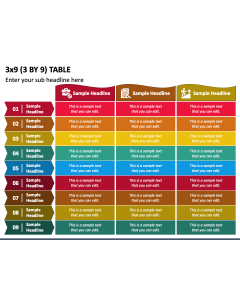

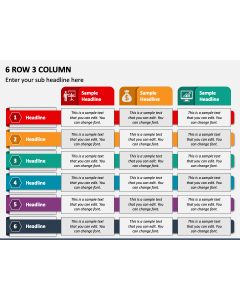
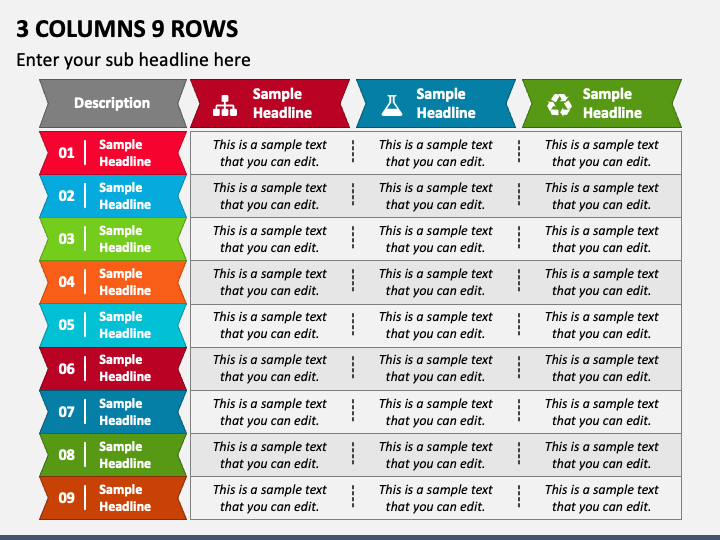
With our 3 Columns 9 Rows presentation graphic for PowerPoint and Google Slides, you can present a chunk of information in a structured and organized way. The slide features a tabular illustration with enough space for the desired text.
Project managers can use the infographic to display the assignments for team members, project timelines, and other related information. Similarly, business development executives can utilize it to showcase a comparison between their products’ pricing and features with those of their competitors.
Impressive Features
- You won’t get copyright infringement problems associated with this infographic.
- The illustration can be easily customized to your liking without any trouble.
- The graphic retains its original quality, even when projected on a larger screen.
- Our customer support executives are available to assist you with any concerns 24/7.
Use this eye-catching infographic in your presentations to put across your message in style and capture your audience’s attention!