


Similar Products
-

-
- Sale
- Sale
- Sale
- Sale


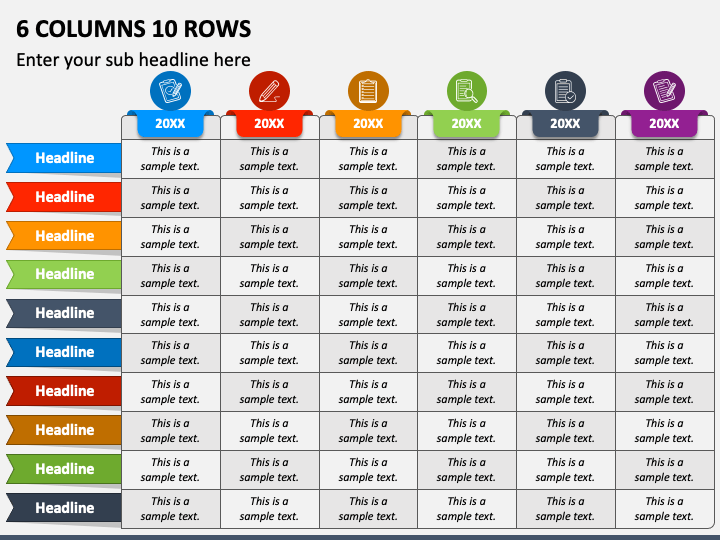
Condense your text to essentials using our 6 Columns 10 Rows presentation graphic, designed for PowerPoint and Google Slides. Business leaders can use this fully editable PPT to demonstrate the market share across different product lines, the innovative pipeline of their company, and the change in employee retention rate over the years. Sales and marketing professionals can leverage this visual to represent the competitive landscape and the increase or decrease in return on different investments over the last six years.
The PPT portrays an appealing 6-column and 10-row table with attention-grabbing icons and editable text placeholders in striking color schemes. Grab this outstanding slide today!
Important Features
- Our qualified customer support executives are always available to resolve your queries at the earliest.
- The infographic has been prepared after careful research to refrain from copyright issues.
- You can display the high-definition vector on large screens without fretting about the quality.
- Without technical expertise or external support, you can customize the color and content in cells in just a few minutes.
Write Your Own Review

Related Products


