5 Out of 10 People Infographic
5 Out of 10 People Infographic
(1 Editable Slide)

Related Products


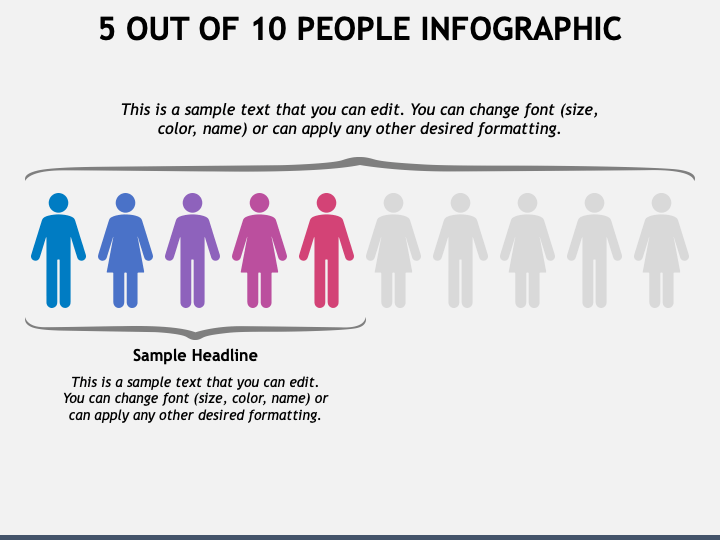
We have introduced the 5 Out of 10 People Infographic slide for PowerPoint and Google Slides to help you add meaning to your textual information and make comprehension easy. The slide features colorful and black-and-white silhouettes of males and females. It also offers ample space to insert the desired text.
Surveyors can capitalize on this illustration to display the results of a survey poll, like 5 out of 10 people prefer product A over product B, choose quality over price, exercise regularly, and more. Customer success managers can portray the number of satisfied customers with a product or service. Further, you can leverage this graphic to accentuate the data and information about social media usage, financial trends, educational statistics, political or social opinions, etc.
Features
- It is an effortless task to modify the layout according to your preferences.
- The visual quality will remain the same, regardless of the screen size.
- Our designers have thoughtfully crafted the illustration to ensure users don’t face copyright-related problems.
Download this PPT to leverage the power-packed graphic and improve your presentations’ impact!