

Free - 5x12 Table for PowerPoint and Google Slides
Free - 5x12 Table for PowerPoint and Google Slides
(1 Editable Slide)
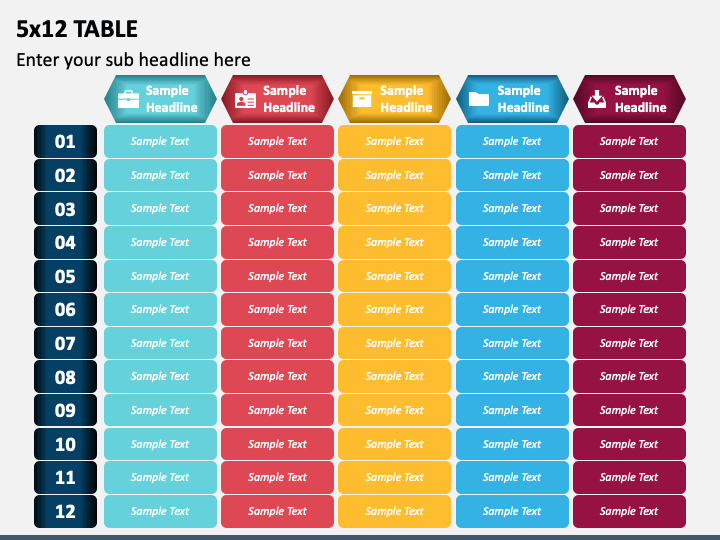
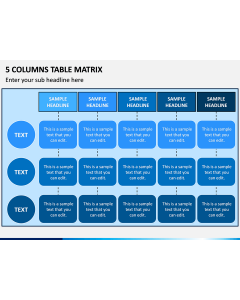
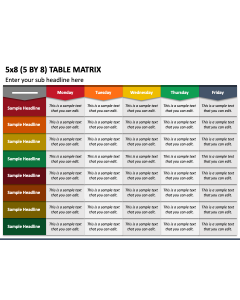
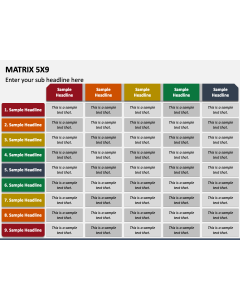
Lay your hands on our 5x12 Table presentation graphic for PowerPoint and Google Slides to display data in a clear and concise manner. Project managers can capitalize on this aesthetically designed PPT to illustrate different stages of the ongoing projects and the time required to accomplish them. Sales and marketing managers can compare the sales figures for different services or products their company offers. Product managers can use this table to list the features and specifications of their products. Finance experts can use this visual to depict financial reports, such as balance sheets, cash flow statements, and income statements.
The slide features a table with 5 columns and 12 rows. For making your information more clear, serial numbers and incredible icons are provided in the graphic. It's easy to replace the dummy text in the editable text placeholders with your own content. You can structure an excellent slideshow quickly by downloading this captivating PPT today!
Salient Features
- The high-definition element lets you display the data on different screen sizes without impacting the resolution.
- The graphic is usable for a lifetime after downloading it once, meaning the presenters can use it as long as needed.
- We have conducted extensive research while designing the table graphic to ensure you don't infringe on copyright laws.
Download this breathtaking slide now!