

Free - 8x10 Table for PowerPoint and Google Slides
Free - 8x10 Table for PowerPoint and Google Slides
(1 Editable Slide)
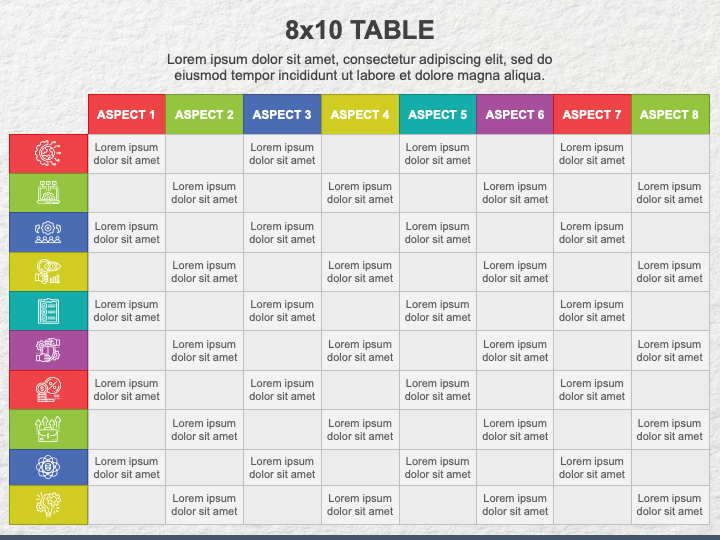
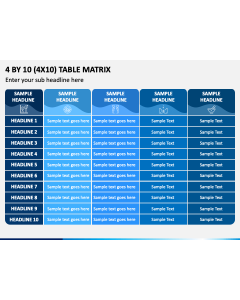
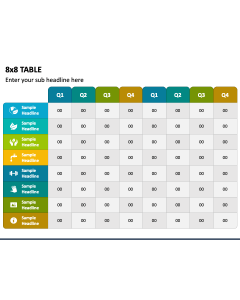
Showcase the complex textual information clearly and concisely with our 8x10 Table graphic for PowerPoint and Google Slides. The slide features a tabular infographic of eight columns and ten rows. The visual is adorned with captivating icons, vibrant color contrast, and customizable text placeholders.
Financial experts and accountants can leverage this illustration to highlight monthly revenues, expenses, profit margins, and other key metrics over a specific period. HR managers can use this versatile infographic to portray employee performance metrics. Marketing professionals can also use this graphic to display key performance indicators of marketing campaigns. You can also depict training program schedules, the customer feedback summary, and more.
Features
- Assured hassle-free editing
- High-resolution graphics
- No room for copyright issues
- 24/7 accessible support staff
Download this PPT now!