

Free - 9x3 Table for PowerPoint and Google Slides
Free - 9x3 Table for PowerPoint and Google Slides
(1 Editable Slide)
Product Details
(1 Editable Slide)
Available For
PowerPoint
Keynote
Google Slides
Canva Slides
Animation:
Yes
Related Presentation Templates
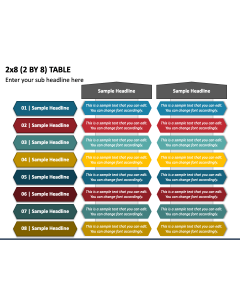
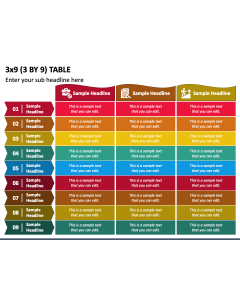
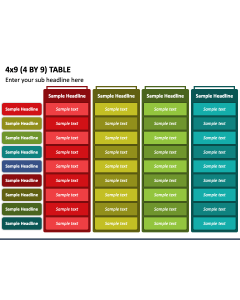
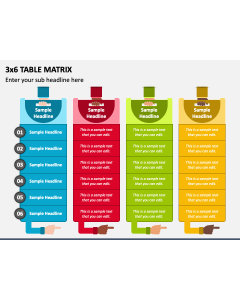
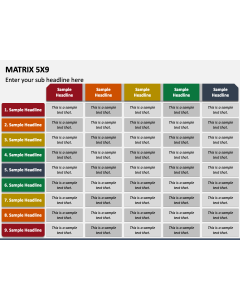
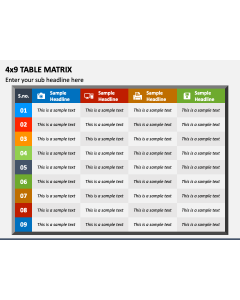
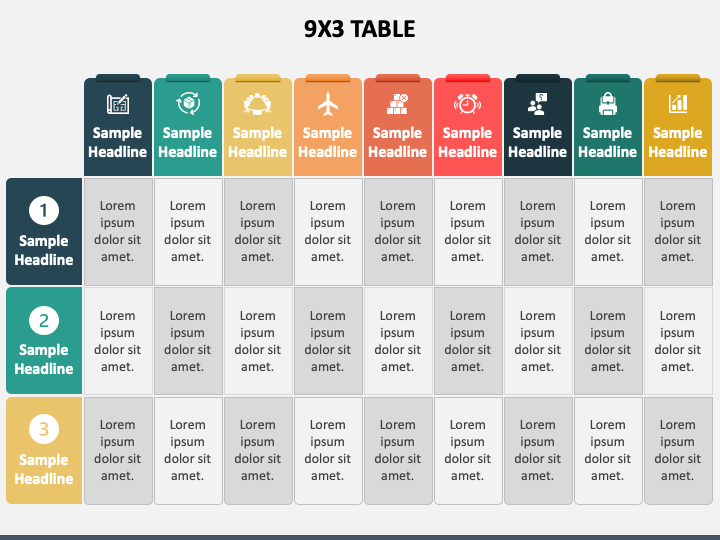
Lay your hands on our 9x3 Table presentation graphic for PowerPoint and Google Slides to showcase complex data and information in a simplified and easy-to-understand manner. The slide features a tabular infographic with stunning icons and editable text placeholders.
This versatile graphic can be used to showcase comparisons, pricing structures for different products and services, to-do lists, survey results, and more. Sales professionals can display sales figures, revenue, or financial data, highlighting trends, growth, or fluctuations. You can also illustrate employee performance metrics, project progress, etc.
Features
- You can make the changes without encountering restrictions.
- The visual ensures uninterrupted resolution on all screen dimensions.
- Our designers have crafted the PPT from scratch to avoid copyright infringement issues.
Download this PPT without any second thought!