


Similar Products
- Sale

- Sale
- Sale
- Sale
- Sale
- Sale
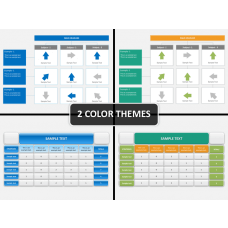


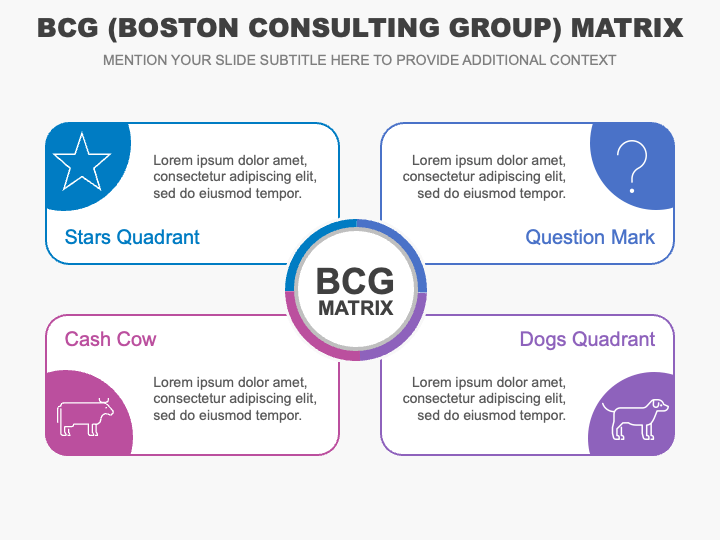
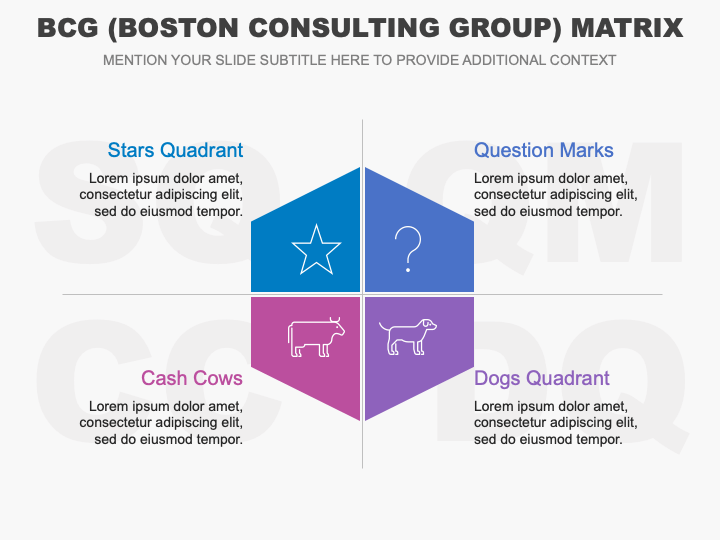
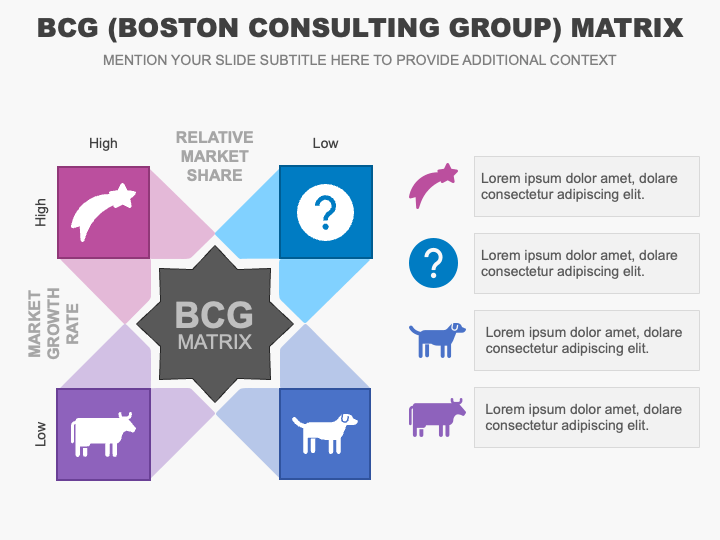
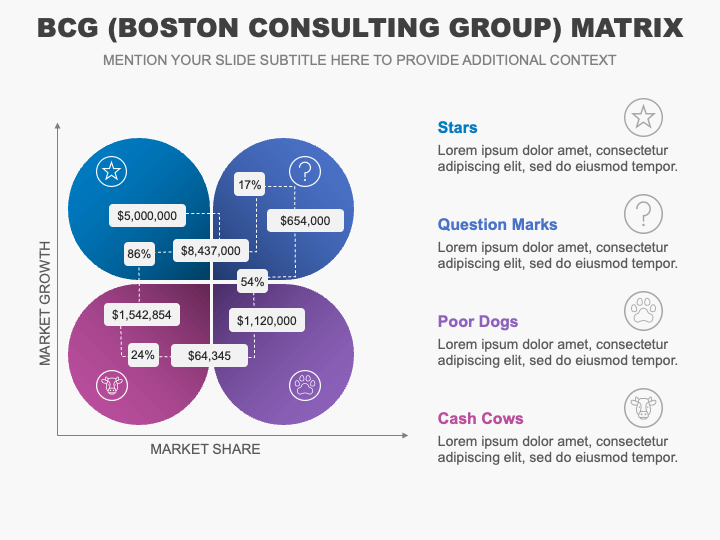
Leverage our BCG Matrix Infographics for PowerPoint and Google Slides to showcase a strategic management framework that helps analyze the performance of a company’s product portfolio. Business analysts can use these graphics to describe how each quadrant of the matrix helps make informed decisions about resource allocation, investment policies, and maximizing profitability. Consultants and marketers can use these visuals to explain how this framework helps formulate marketing strategies and optimize product portfolios. You can also showcase how the BCG matrix aids investors in evaluating the strategic positioning and growth potential of companies.
The slides feature various stunning infographics presenting the BCG matrix's quadrants Stars, Question Marks, Cash Cows, and Dogs. The subtle color contrasts and appealing icons will help you enrich your content and facilitate easy understanding. Editable textual boxes allow the insertion of the desired text.
Features
- Tailor the visuals to suit your preferences without prior editing knowledge or external assistance.
- You can scale the graphics on any screen dimension without hampering the original quality or resolution.
- Our experienced designers have carefully crafted the set to eliminate the room for copyright issues.
Boost your presentation with this graphic-rich PPT; download it now!
Write Your Own Review

Related Products


