

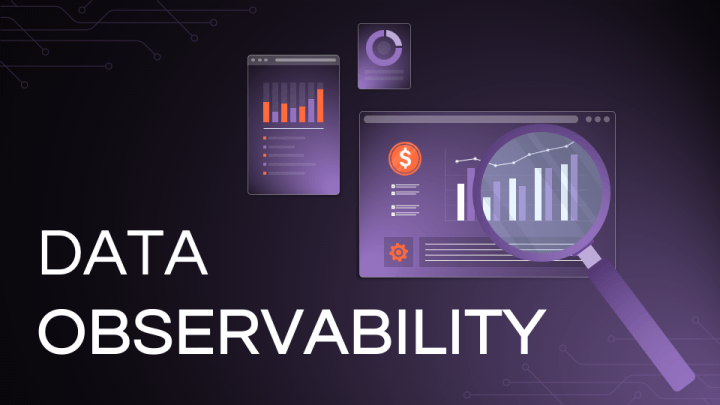
Data Observability PowerPoint and Google Slides Template
Data Observability PowerPoint and Google Slides Template
(8 Editable Slides)
Related Presentation Templates


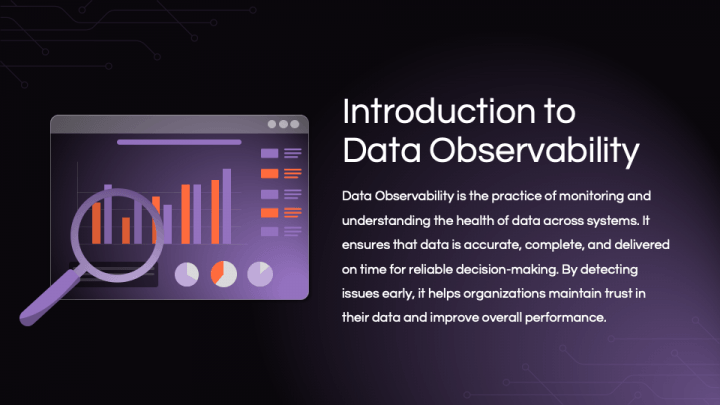
Data pipelines break quietly — and by the time someone notices, the damage is already done. Helping engineering leads, data teams, and business stakeholders understand observability isn't just a technical briefing; it's a case for proactive infrastructure investment.
The Data Observability PowerPoint and Google Slides template gives data engineers, analytics managers, and platform architects a sharp, structured way to present monitoring frameworks, data quality metrics, and pipeline health strategies. It's designed for people who live in dashboards and terminals but occasionally need to make their work legible to a wider room.
Who Is This Template For?
This template fits professionals who work with data infrastructure and need to communicate its value or status to mixed audiences.
- Data engineers presenting pipeline monitoring strategies to technical and non-technical teams
- Analytics managers reporting on data quality and reliability to business stakeholders
- Platform and infrastructure leads building internal cases for observability tooling
- Data consultants advising organizations on modern data stack governance
- Educators and course instructors teaching data engineering or MLOps concepts
What's Inside the Template
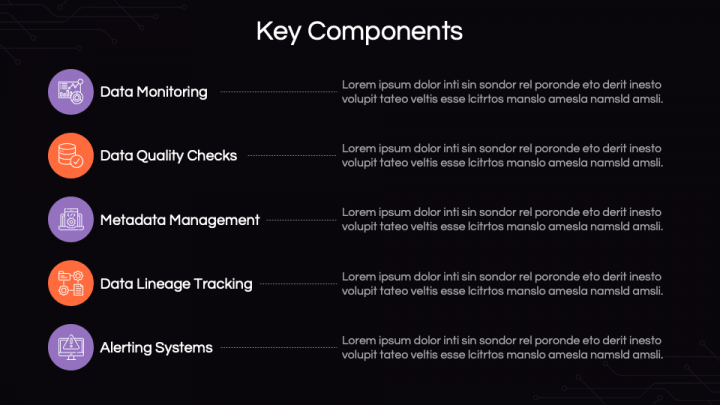
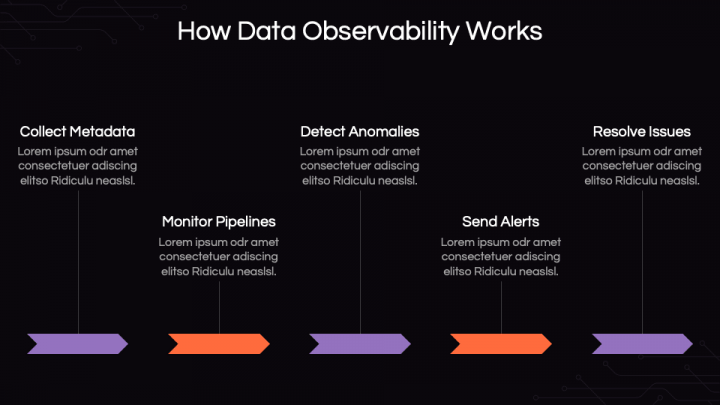
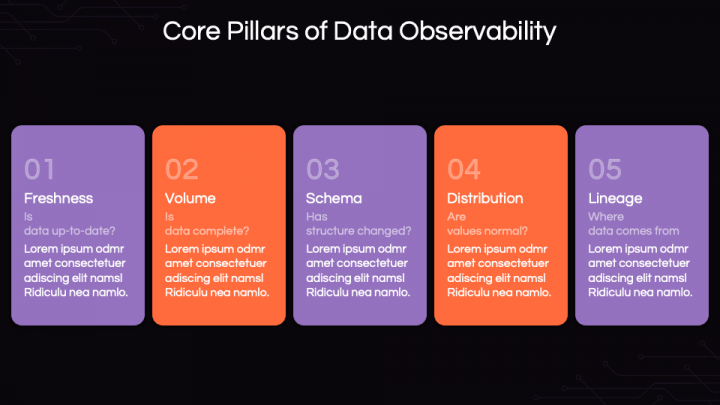
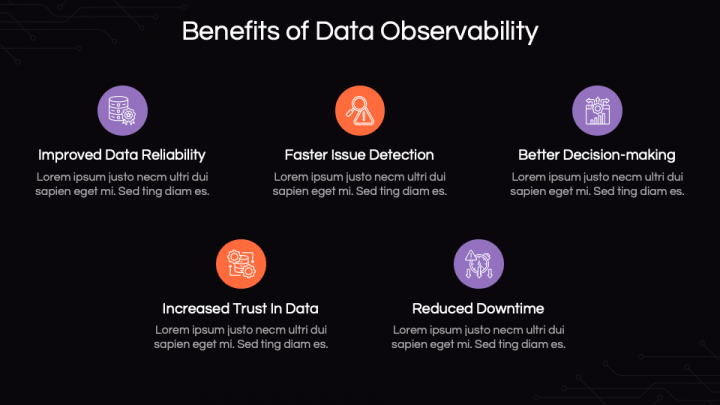
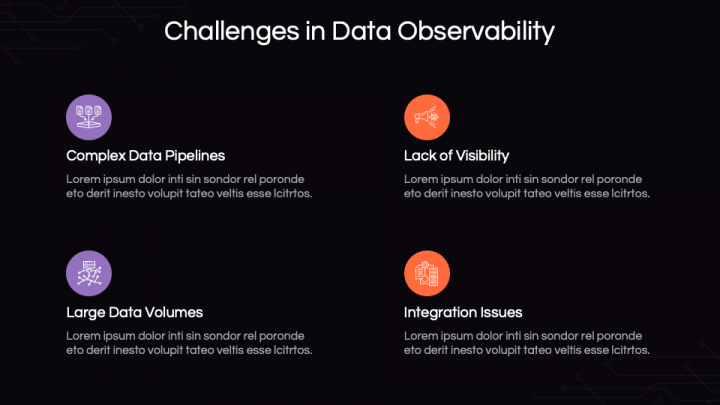
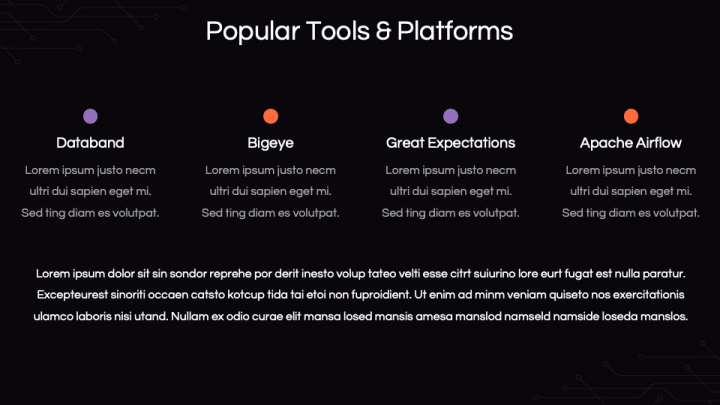
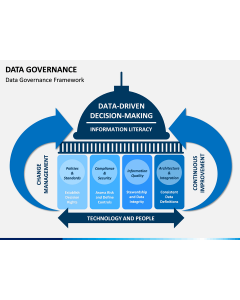
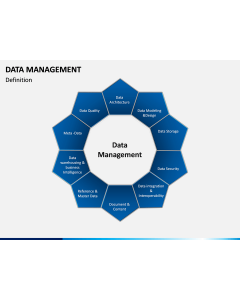
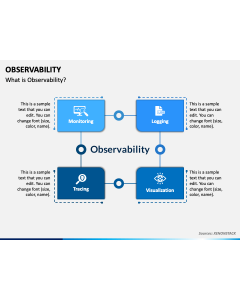
The Data Observability PPT includes slides for pipeline architecture overviews, data quality scorecards, anomaly detection workflows, SLA tracking, and incident summary layouts. The design is clean and structured — the kind of visual language that data professionals will find credible and business audiences will find accessible. Charts, flow diagrams, and metric display slides are all included and ready to customize.
Every element is fully editable, so you can plug in your actual metrics, update architecture diagrams, and adjust the visual style to match your organization's standards. The deck provides enough layout variety to cover everything from a technical deep-dive to a high-level executive summary — without needing to build additional slides from scratch.
Compatible with both Microsoft PowerPoint and Google Slides, the template travels well across teams and workflows. The Google Slides version works entirely in-browser, which is especially useful for distributed data teams collaborating across time zones.
Observability is about making invisible problems visible. Your presentation should do the same for your audience. Download this template and walk your stakeholders through the full picture with confidence.