

International Day of Banks Presentation - Free Download
International Day of Banks Presentation - Free Download
(15 Editable Slides)


Related Presentation Templates


International Day of Banks is commemorated annually on December 4th to recognize the importance of banking systems in economic growth. Established by the United Nations General Assembly in 2019, the day highlights the contribution of banks and other financial institutions to driving sustainable development and enhancing people’s lives. Various activities are organized to educate the public about the responsibilities of banks. The day also provides an opportunity to acknowledge the pivotal role of banks in rendering financial services, building resilient economies, and advancing progress, especially in developing countries.
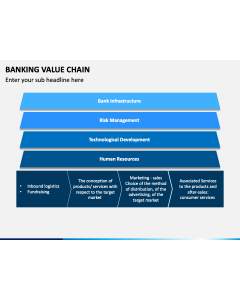
Leverage our International Day of Banks template for PowerPoint and Google Slides to showcase more details about banks and their functions. With sleek and modern designs, structured layouts, stunning icons, and a vibrant color scheme, the slides increase the visual allure of your presentation and bring the content to life.
Let’s Look at the PPT’s Overview
- Set the tone for your presentation through our splendid cover slide.
- Use the Table of Contents slide to portray the presentation’s agenda.
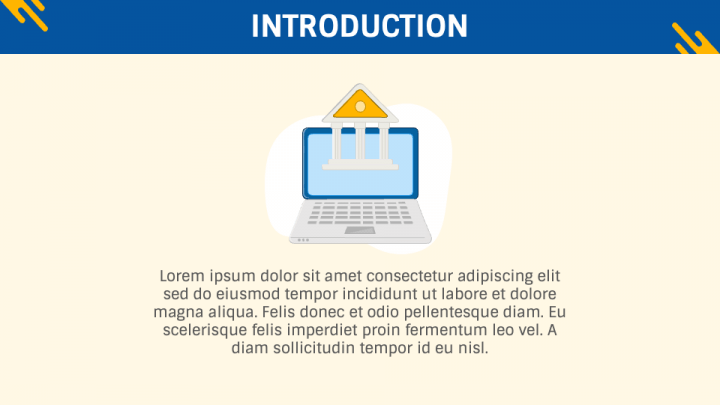
- With the laptop illustration, you can depict the overview of the International Day of Banks.
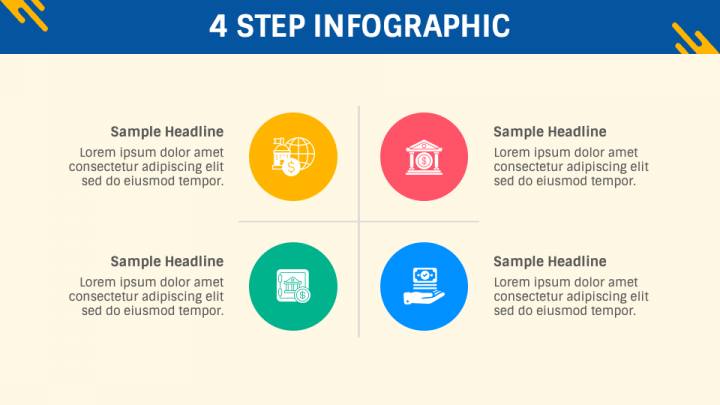
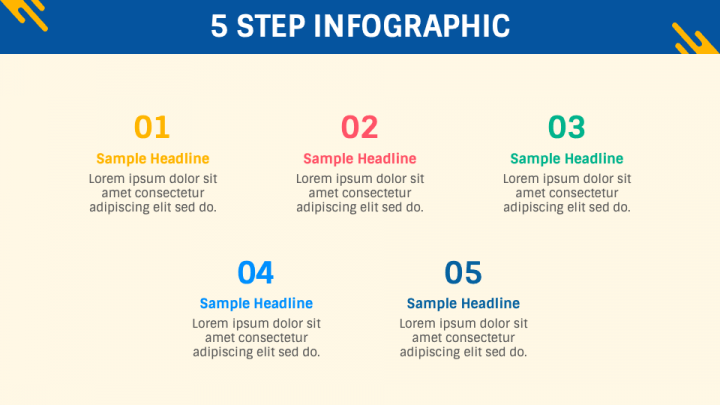
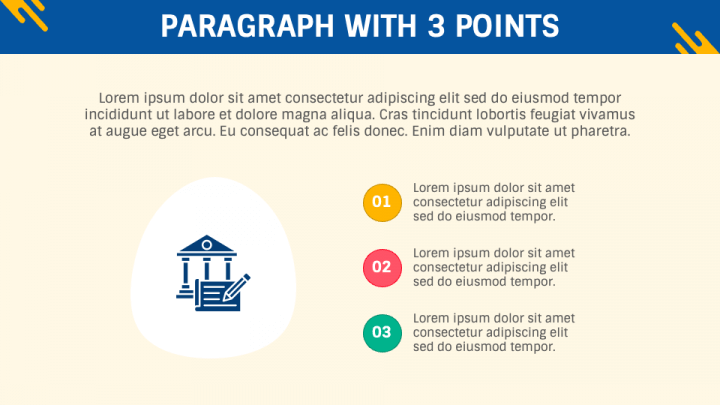
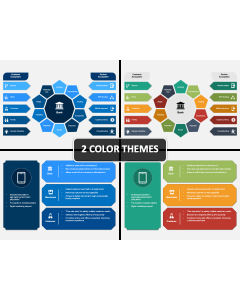
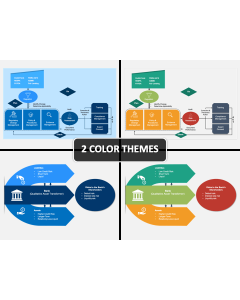
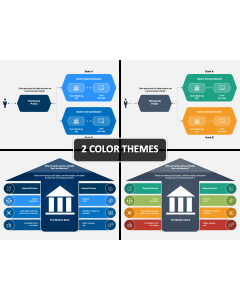
- Multi-step infographics can be used to illustrate the role of banks, challenges addressed by international banking, and more.
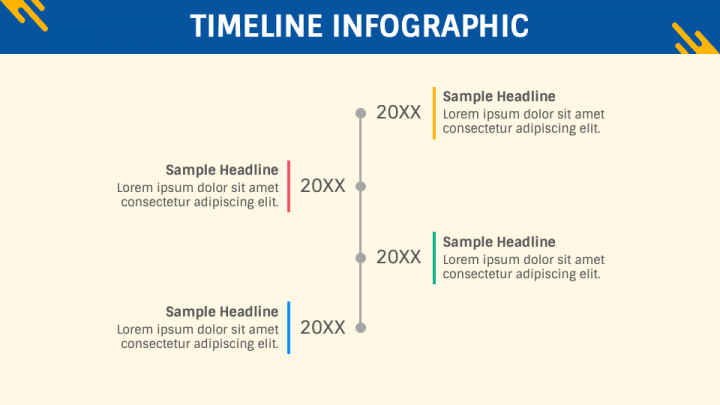
- A timeline graphic can be used to portray the key milestones and events related to the development and recognition of banks in global finance.
- Use the quote infographic to display impactful statements about the significance of banks in global development.
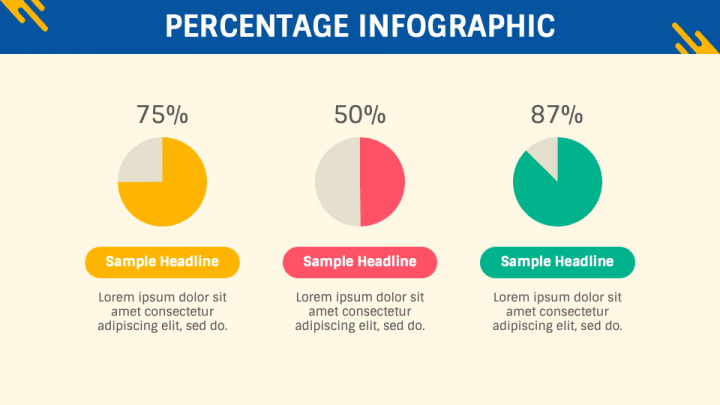
- The pie charts can be used to showcase the percentage of the world’s population with access to formal banking services, banking contributions to economic development, types of financial institutions, and more.
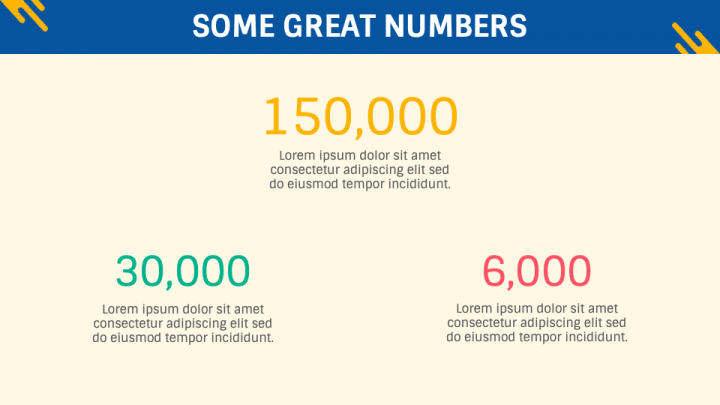
- Display the total number of banks worldwide, the percentage increase in digital banking users, the number of jobs created or businesses supported by banks, etc., via a stats infographic.
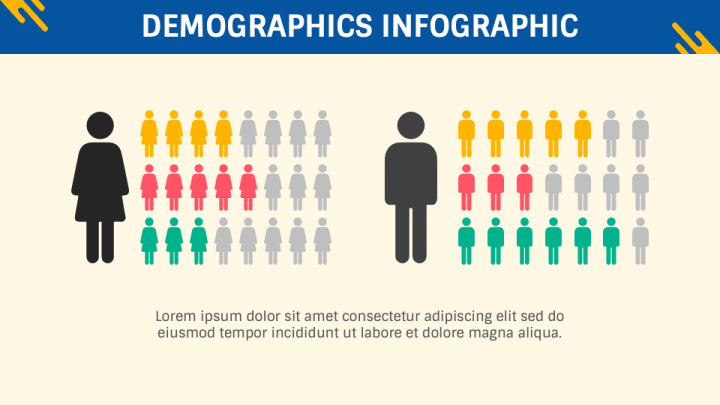
- Depict the breakdown of banked population, banking services access, digital vs. traditional banking usage, etc., by age, gender, and income level through a demographics infographic.
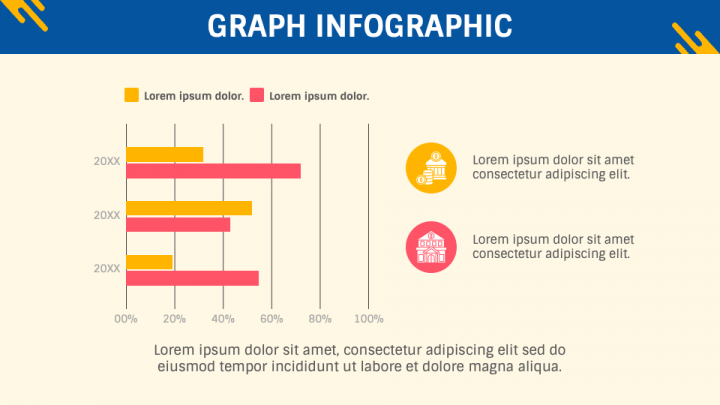
- A bar graphic can be used to display the yearly growth in banking users.
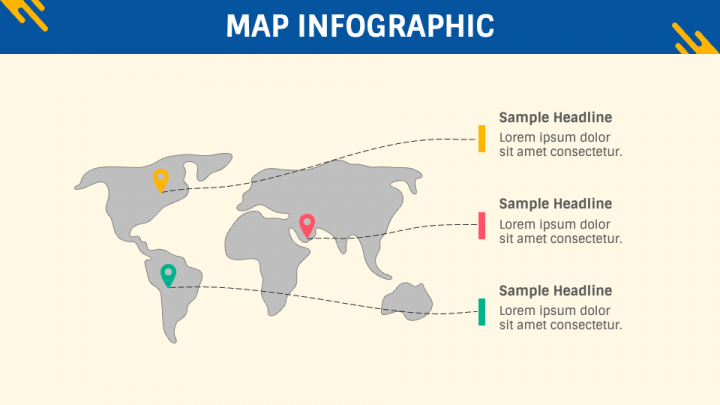
- A map diagram can be used to highlight the regions with the most and least banked populations.
- Use the ‘Thank You’ slide to convey an appreciation to the audience for their unwavering attention.
Features
- Easy customization
- Assured high-definition graphics
- Free from copyright issues
- Lifetime usability
Download this PPT without any delay!