

Inventory Statistics PowerPoint and Google Slides Template
Inventory Statistics PowerPoint and Google Slides Template
(7 Editable Slides)
Related Presentation Templates

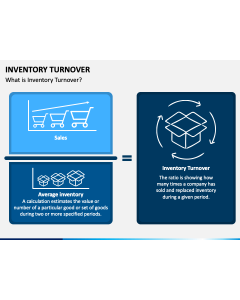
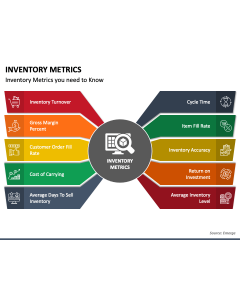
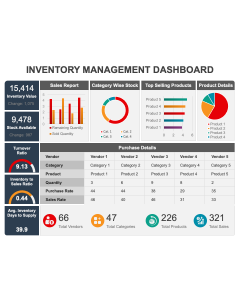

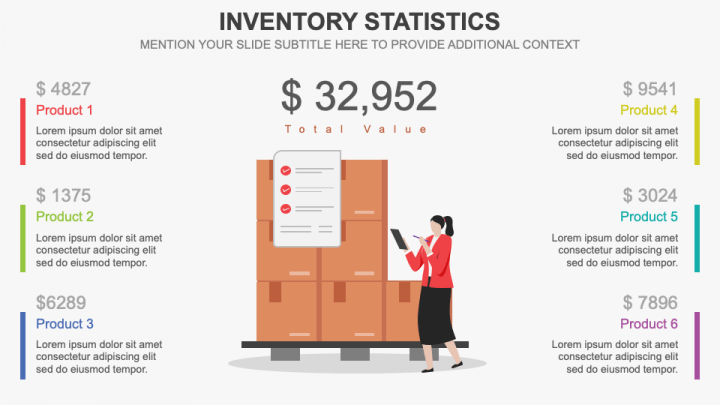
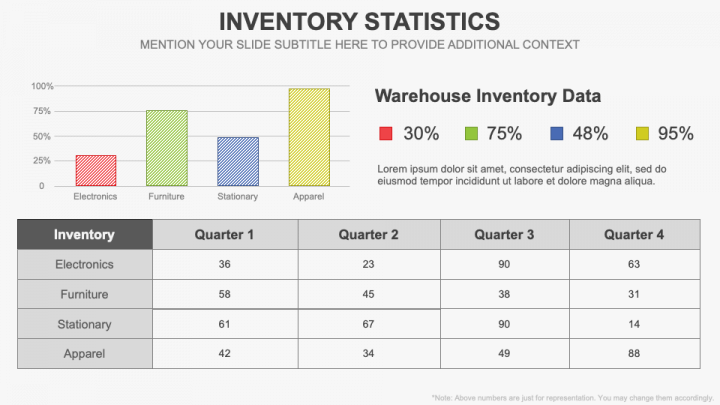
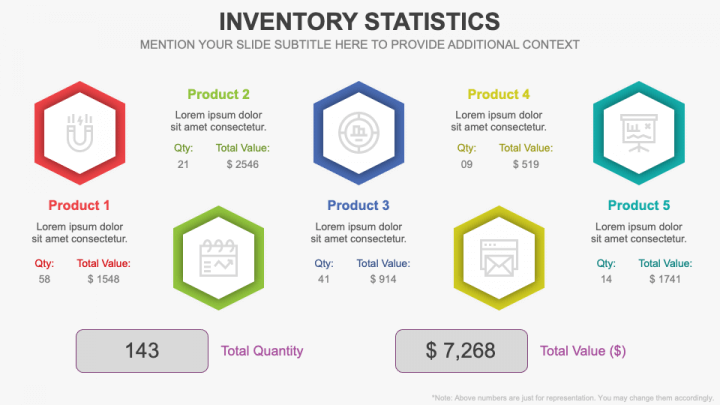
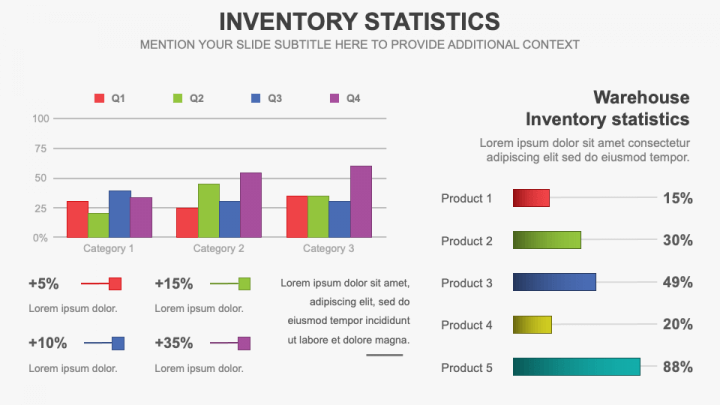
Use our Inventory Statistics template for PowerPoint and Google Slides to visually reinforce the data and insights about inventory management. Operations and supply chain managers can utilize high-definition visuals to depict total inventory value, stock levels by category, inventory turnover ratio, year-on-year or month-on-month inventory level comparisons, etc. Warehouse managers can present the average time inventory stays in stock before being sold, the stock level at which new inventory orders are triggered, the percentage of orders fulfilled without delay, etc. Sales professionals can use this pre-designed set to showcase the contribution of different products to the overall sales for a specific period. The deck featuring eye-catching infographics also comes in handy to portray the demand forecasting of different products.
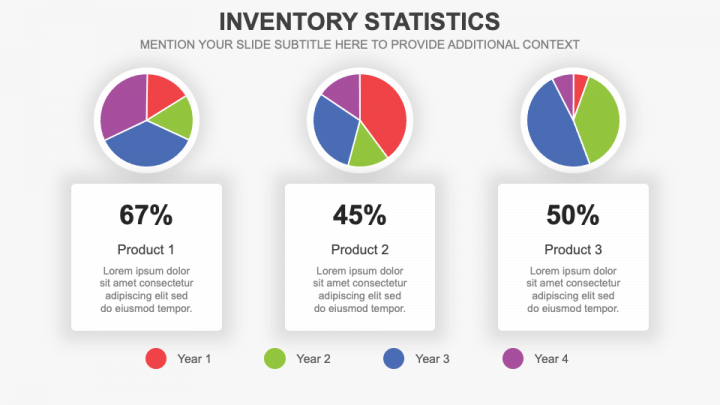
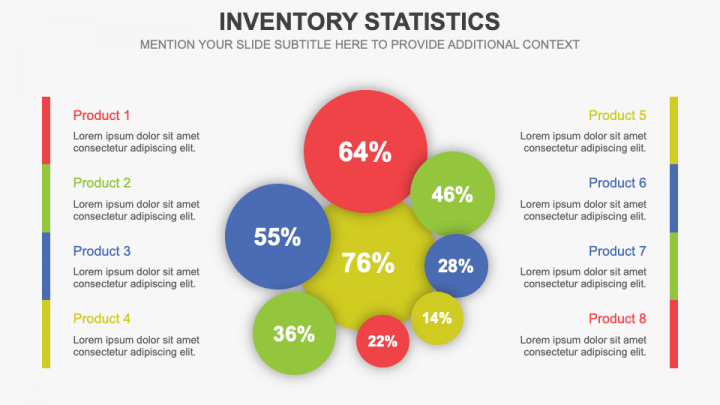
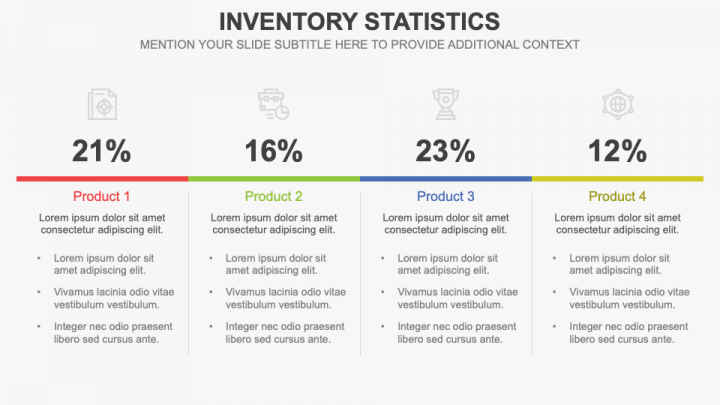
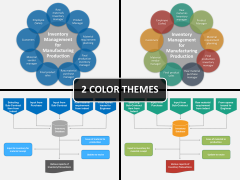
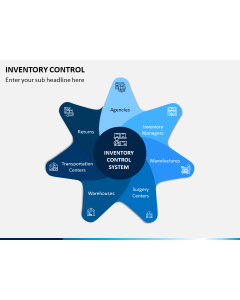
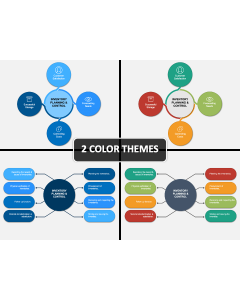
The slides boast high-definition vectors, including a female holding a pen and paper checking inventory boxes, a table and a bar chart, quadrilateral-shaped boxes, pie charts, various circles, and more. The infographics are beautified with stunning icons and a vibrant color scheme and will help you present your data excellently. Editable textual boxes are provided for easy accommodation of relevant content.
Features
- Effortless customization
- High-resolution visuals
- Free from copyright issues
- Repurposable for a lifetime
- 24/7 customer support
Download this feature-rich PPT to improve the visual allure of your presentation!