
Key Statistics PowerPoint and Google Slides Template
(4 Editable Slides)

Key Statistics PowerPoint and Google Slides Template

SB16666
Available For


Similar Products
- Sale

Revenue Projection Infographics PowerPoint and Google Slides Template
(13 Editable Slides)
- Sale
- Sale
- Sale
- Sale
- Sale


Grab our Key Statistics template for PowerPoint and Google Slides to present your data and survey results in an organized manner, ensuring easy comprehension and retention. Business analysts can capitalize on this deck to portray the findings about a specific industry, including its size, key players, market share, customer base, etc. Financial professionals can use vector-based visuals to illustrate the change in the company’s revenues, sales, and profitability compared to the last year. Marketers can use this pre-designed set to display the demographics of a specific market segment or the distribution of an enterprise’s or product’s user base based on age, gender, and location. Digital marketing managers can present data related to user engagement, website activity, and more. Government agencies can also use this PPT to showcase the percentage distribution of the national budget across different sectors and demographic information, such as income distribution, employment rates, etc.
The slides comprise
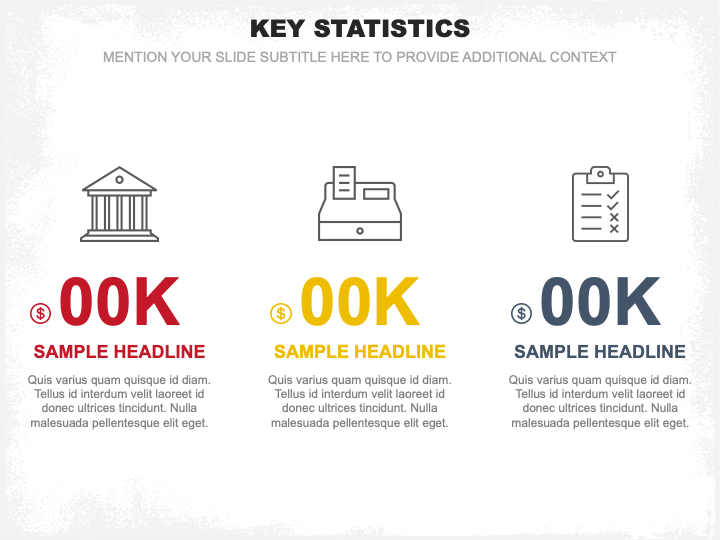
- Icons of a house, a printer, and a clipboard
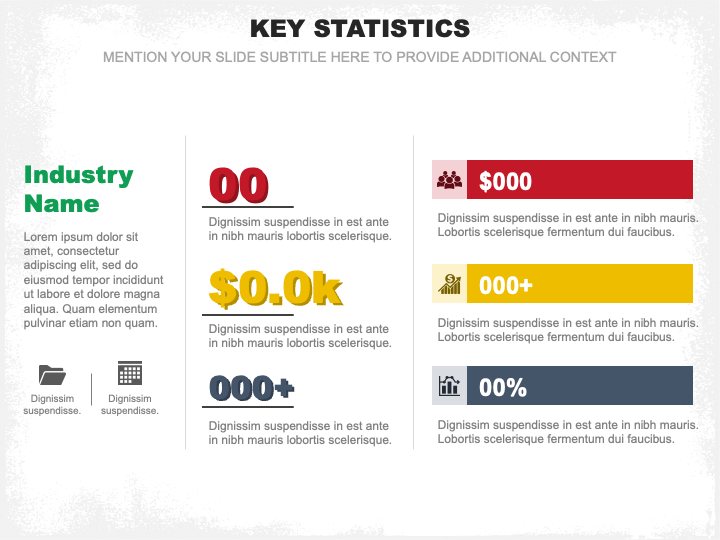
- A layout featuring bar graphs and signs of a dollar currency, percentage, and more
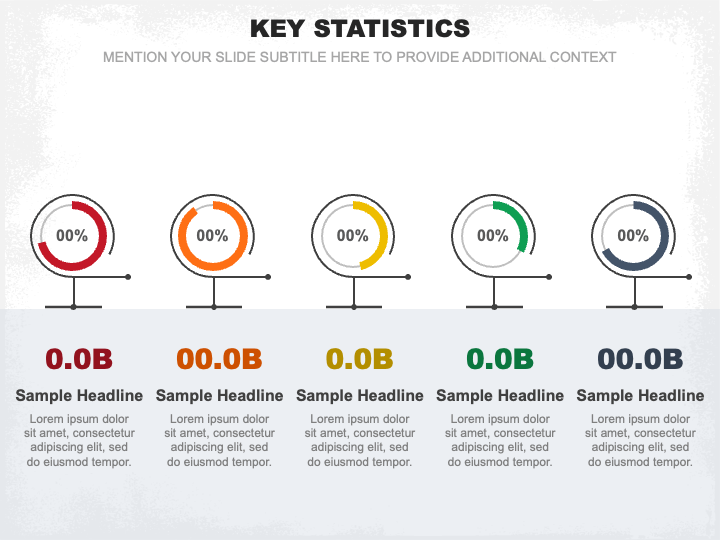
- Donut charts with percentage symbols
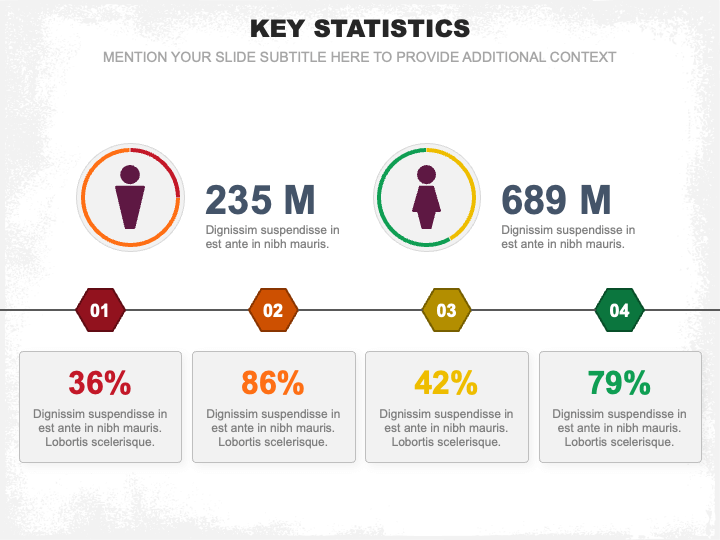
- A silhouette of a male and female with percentage signs
Features
- Edit the deck elements to suit your preferences without confronting challenges.
- The original quality or optical resolution won’t get affected, even when projected on a bigger display.
- All attributes are designed from scratch to eliminate the room for copyright issues.
Download this versatile PPT now!
Write Your Own Review

Related Products


