Infographics Charts for PowerPoint and Google Slides
Infographics Charts for PowerPoint and Google Slides
(16 Editable Slides)
(16 Editable Slides)
Infographics have changed the way we share and consume information. Since readers are able to gain a lot of knowledge in less time with infographics, they are used in almost every industry. Now, you can also include such graphics in your presentations using this professionally drafted Infographics charts PPT. Instead of spending hours making an infographic from the square one, you can readily use the illustrations provided in this set. They are drafted by our designers and come without any copyright limitations.
Professionals belonging to almost every domain can use these charts. You can make use of these illustrations to explain a progress report, consumer behavior, company hierarchy, sales report, and so much more. It doesn’t matter if you belong to marketing or sales, IT or research – if you want to draft visually appealing and informative slideshows, then you should certainly download this template. It will surely make your everyday presentations look interesting and will make it easier for your audience to retain the provided information as well.
Features
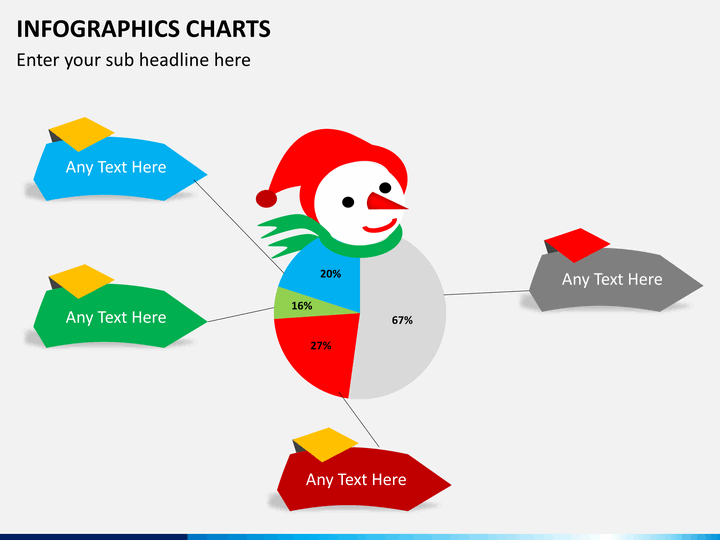
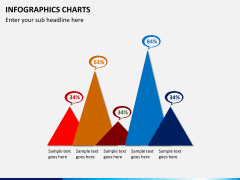
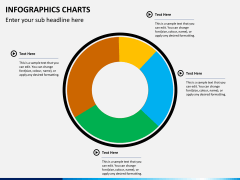
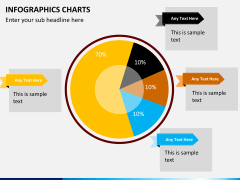
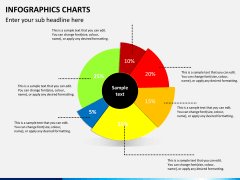
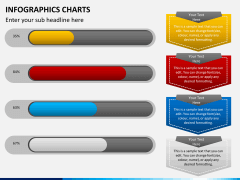
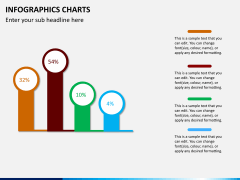
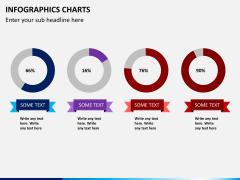
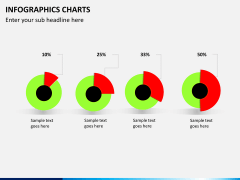
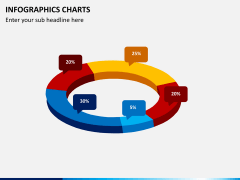
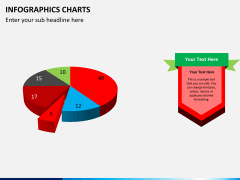
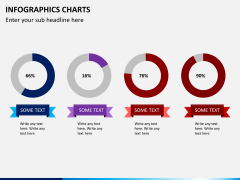
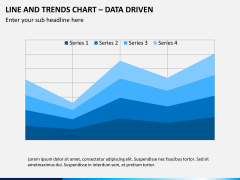
- There are different kinds of charts in this set. From bar graphs to pie charts and world maps to pyramid models, you will find all sorts of illustrations in this template.
- All these charts are vector-based and of high-definition. You won’t face any trouble editing them. Change their appearance, size, or provide your own content without any hassle.
- You can simply clip out the illustration of your choice and include it in any other PowerPoint document. Later, you can alter it as per your needs.
- The template will certainly help you save your time and efforts while drafting a remarkable presentation.
- It comes with a dedicated customer support so that you can make the most of it without facing any complication.
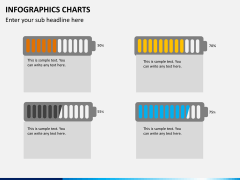
Download this template once and use these illustrations over and over again in a hassle-free manner. The set consists of high-definition and vector-based illustrations that are extremely easy to edit. You can draft infographics related to bar graphs, charts, battery levels, world map, and more with this one-of-a-kind and highly useful template. Simply include these charts in your slideshows, customize them as per your needs, and be sure to grab compliments from your audience.
