People Statistics Infographics for PowerPoint and Google Slides
People Statistics Infographics for PowerPoint and Google Slides
(12 Editable Slides)


Related Products


Grab our People Statistics Infographics for PowerPoint and Google Slides to add depth to your information and data and facilitate an easy understanding. HR professionals can leverage these graphics to depict the distribution of employees based on various aspects, trends in employee turnover rates over time, and stats related to employee training participation, skill development, etc. Marketers can highlight the demographics of target markets, including consumer purchasing patterns, trends in consumer preferences, and factors that impact market demand and buying behavior.
Government agencies can present statistics on population growth, ethnic diversity within a region or country, poverty rates, unemployment rates, and more. NGOs can use these versatile visuals to showcase the statistics on the beneficiaries served, services provided, and outcomes achieved through the specific programs and initiatives. Additionally, these multipurpose illustrations come in handy for presenting the results of a survey or research study.
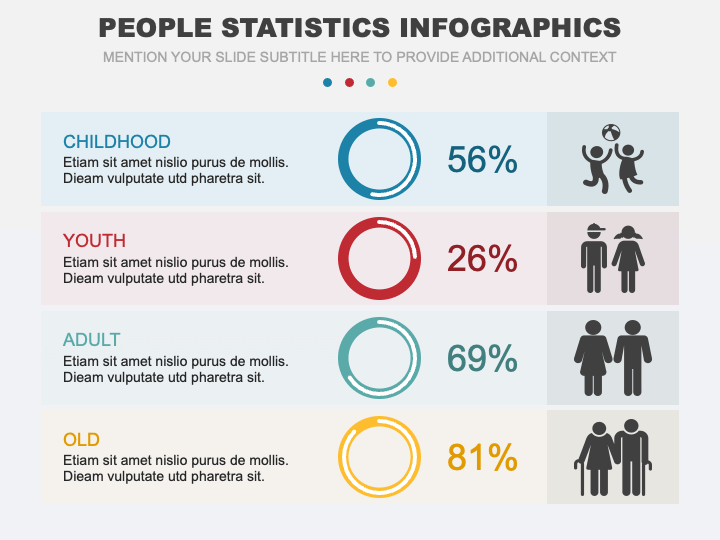
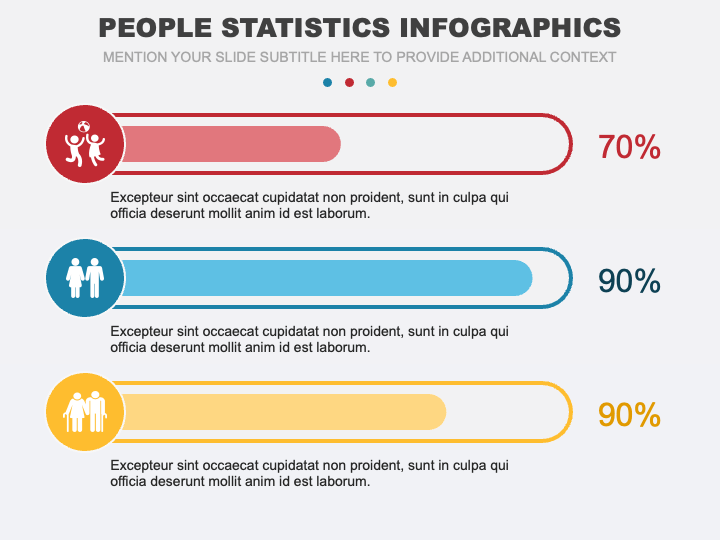
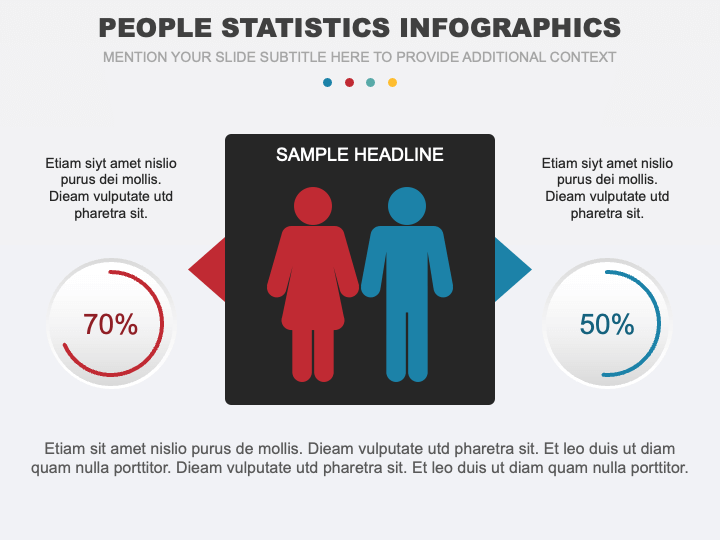
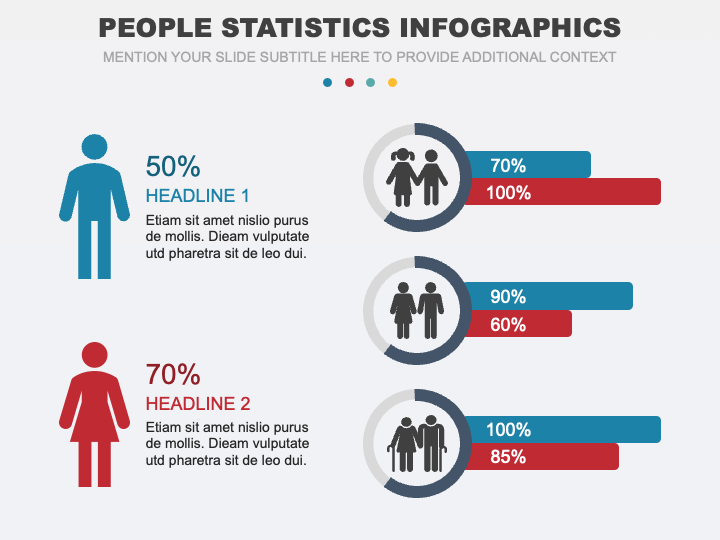
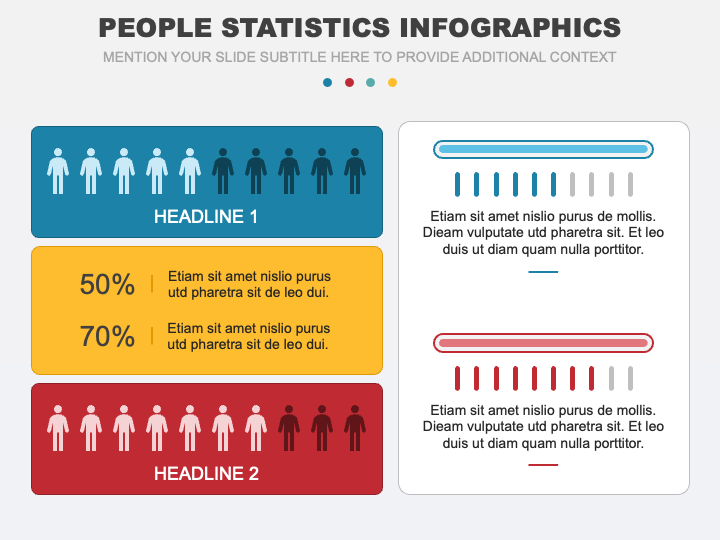
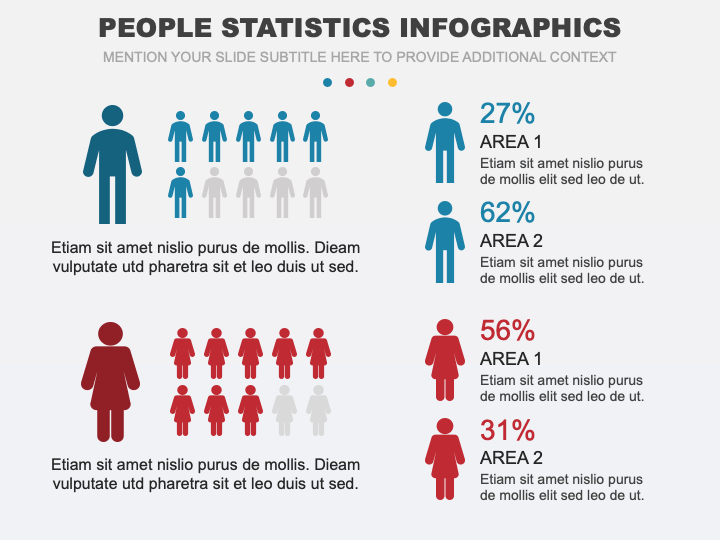
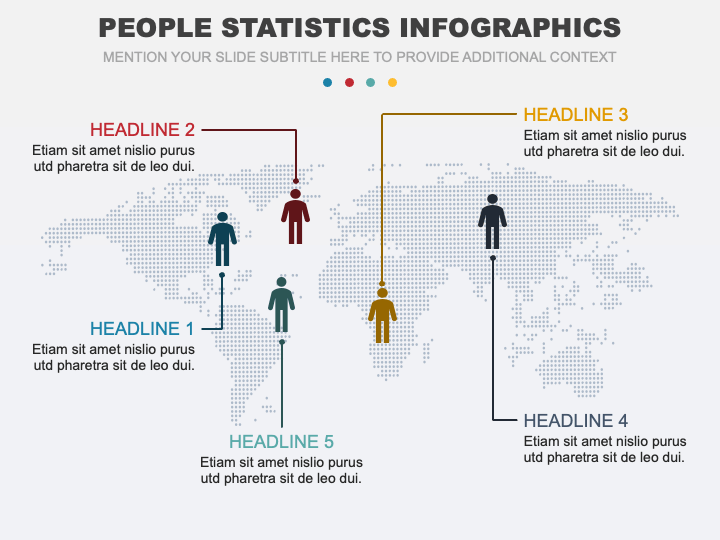
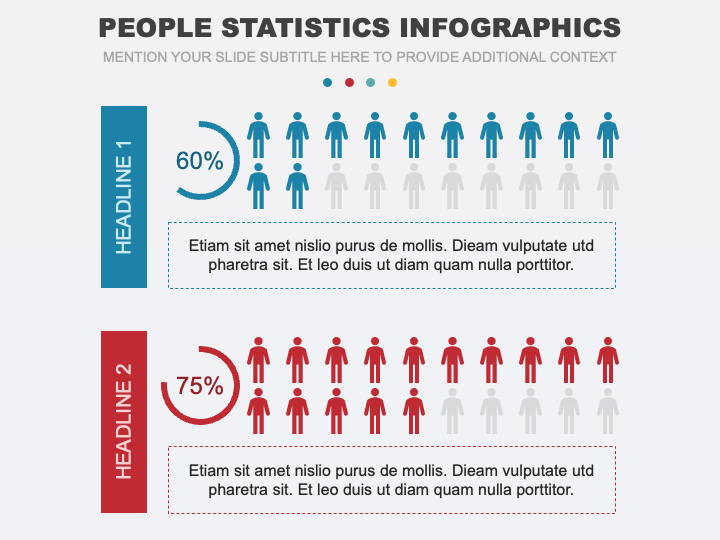
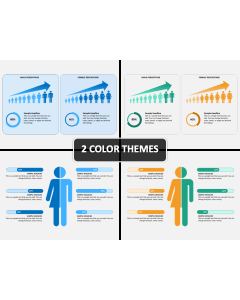
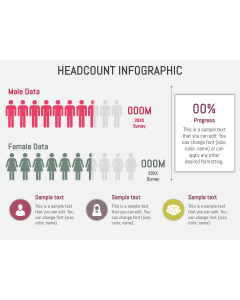
The slides feature striking infographics of donut charts with percentage signs, male and female silhouettes, a dotted map, and more. The visuals are complemented with self-explanatory icons and bright color contrasts to give a touch of creativity to your presentation. Moreover, the editable textual boxes allow the presenters to put their desired content.
Features
- Entirely editable
- High-resolution graphics
- Copyright-free
- Around-the-clock customer support
Download this compelling PPT immediately!