Similar Products
Get your hands on our Rising Chart Infographics PPT template to accentuate the textual data and make your slideshows more creative. Sales and marketing experts can utilize this aesthetically designed deck to exhibit the increase in monthly, quarterly, and yearly sales and revenue. Business leaders and managers can also use these PowerPoint slides to highlight business growth, increase in customer base, profit margins, new recruits, etc.
This awesome template will let you display the data effortlessly. The impressive graphics will give a creative flair to your presentations and quickly grab your audience's attention. Get this phenomenal PPT right away!
What's Inside the Set?
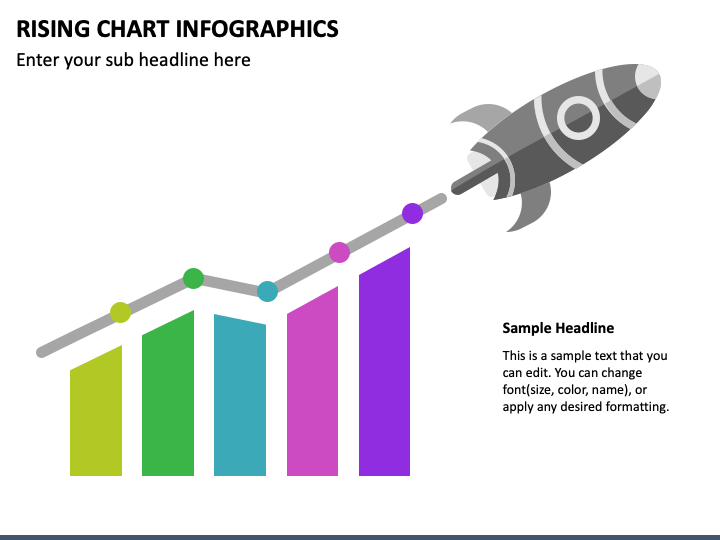
- This slide portrays an infographic of a bar graph and rocket.
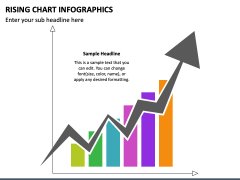
- The bar graph with a zig-zag arrow shows the rise in sales or business development.
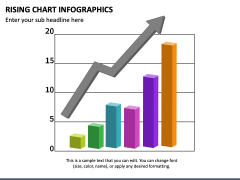
- A graph with an arrow moving upward can be used to showcase the increase in profits over the years.
Distinct Features
- Since our experts have made this deck after careful research, there will be no copyright issues.
- Our proactive customer support executives are available 24*7 to solve your queries.
- These slides have been inserted with high-definition graphics to offer an excellent resolution.
- You can edit this fantastic set in just a few minutes without technical skills or editing experience.
Download this exclusive template now to make a splash!
Write Your Own Review


