


Similar Products
- Sale

- Sale
Sales and Marketing Organization Chart for PowerPoint and Google Slides
(10 Editable Slides)
-
- Sale
- Sale
- Sale


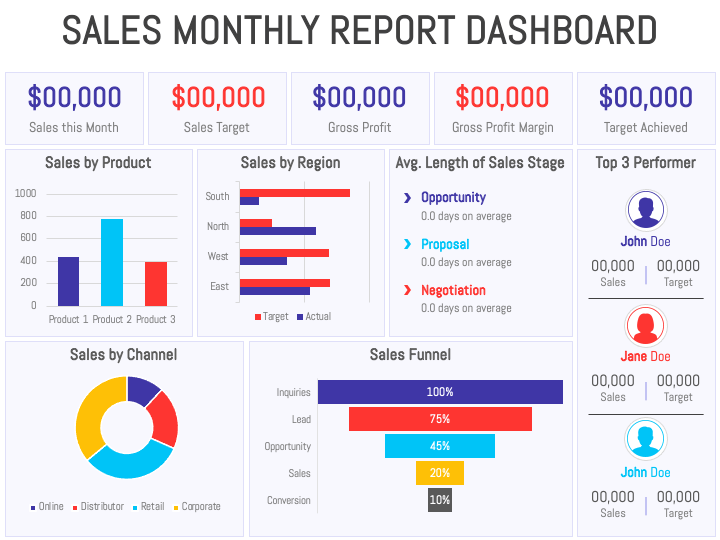
Give a dynamic look to your presentations with our Sales Monthly Report Dashboard slide for PowerPoint and Google Slides. The slide comprises a layout presenting sales by product, region, average sales, etc., through bar graphs and pie charts.
Sales professionals can leverage this graphic to illustrate sales performance, including sales revenue, units sold, average order value, and profitability. You can highlight the breakdown of sales by product or service category, enabling the audience to assess individual product performance. Team leaders can also capitalize on the infographic to display the top-performing salespeople. Further, you can explain how providing insights into sales performance facilitates data-driven decision-making and drives continuous improvement in sales operations.
Features
- 100% editable
- High-resolution graphic
- No room for copyright issues
- 24/7 customer support
Add a flair of creativity and professionalism to your slideshows with this PPT; download it now!
Write Your Own Review

Related Products


