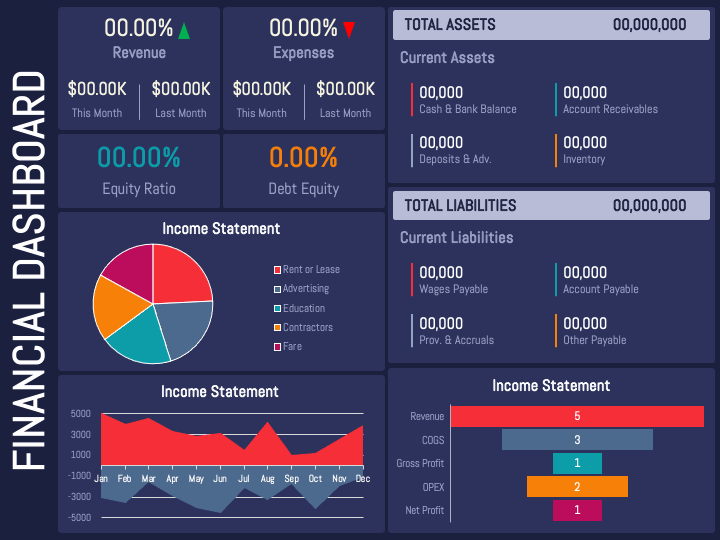
We have introduced the Financial Dashboard slide for PowerPoint and Google Slides to help you showcase your company’s financial data and information in a structured and organized manner. The slide features a stunning dashboard layout with graphs and charts. Using it, you can show the organization's revenue, expenses, liabilities, debt-equity ratio, and other data without increasing the cognitive load on the audience.
Senior executives and financial analysts can use this graphic to communicate the organization’s financial health with the clients, customers, investors, and other stakeholders. You can also represent an overview of the critical financial metrics, breakdown of revenue sources, categorization of expenses, cash flows, a comparison of budgeted figures with actual financial results, etc. Additionally, consultants can describe how financial dashboards help make informed decisions about growth strategies, addressing financial challenges, and more.
Features
- You can modify the visual as per your requirements without any hassle.
- Our designers have crafted the layout with utmost precision to ensure authenticity and originality.
- The graphic quality won’t get hampered, even when projected on a widescreen.
Grab this PPT to add visual engagement to your presentations!


