


Similar Products
- Sale

- Sale
- Sale
-
-
- Sale


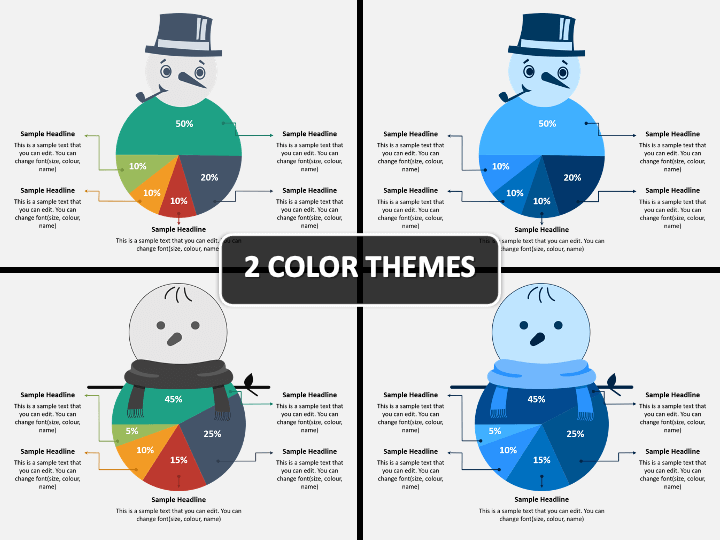
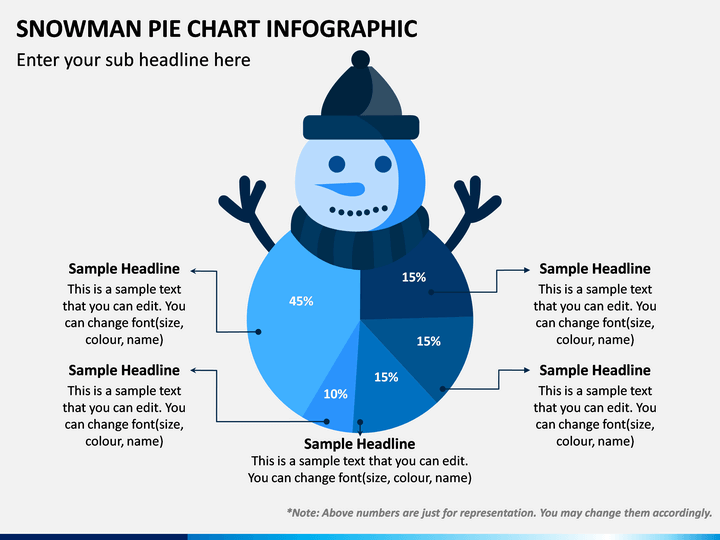
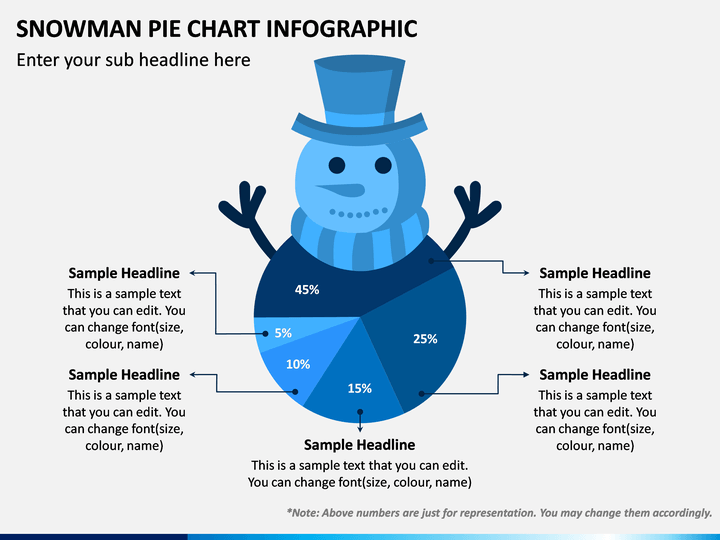
Download our 100% editable Snowman Pie Chart PowerPoint template to showcase the complex statistical information of your business in a simple, organized, easy-to-understand, and eye-catching manner. It is designed with attention to detail by a team of professional designers; hence, you would not encounter quality-related issues. We have kept separate files for different presentation platforms like Microsoft PowerPoint, Google Slides, and Apple Keynote.
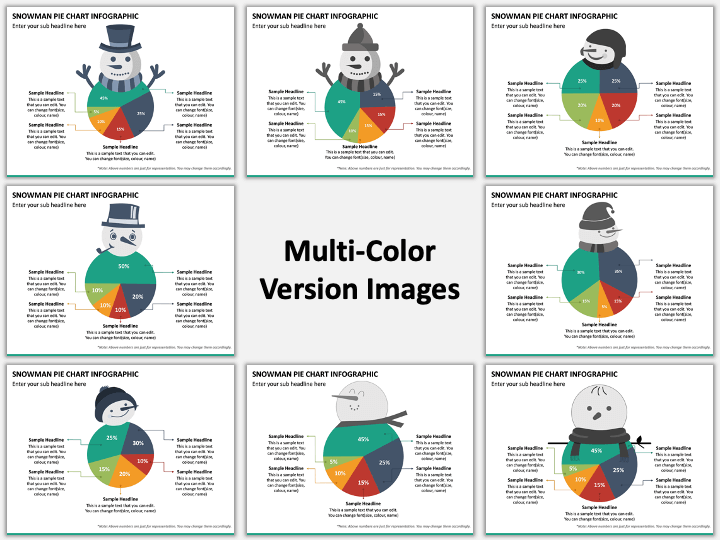
The set is an excellent pick for data analysts, business analysts, sales and marketing managers, senior executives, and startup owners to illustrate the ordinal or nominal category data in a visually pleasing way. You can also represent the proportional or percentage data beautifully. Download the set in blue or multicolor theme now!
Illustrate the Data Accurately and Amazingly
All the slides in the template have unique and captivating designs. Though we have used the best color combination, you have full control to customize it according to your preferences. You can also write content in the text placeholders in the desired font size, style, and color.
You can use any of the slides in your existing presentations to display:
- Comparison of growth areas such as profit, cash flow, revenue, turnover, market share, etc.
- Data analysis and survey results
- Investments in different activities of the business
- The relative size of the market segment
- Comparison of the market value of your product with competitors, and much more.
Spellbind the audience with impeccable data visualization. Download the PPT now!
Features that Make it User-friendly
- We have crafted it in 4:3 and 16:9 aspect ratios for the standard and widescreen.
- You can easily edit the size of the slices (percentage) of pie without fretting about their resolution.
- The HD and vector-based graphics impart superb quality to the template.
- Use it forever after downloading once.
- Seek quick customer support whenever required.
Turn your boring slideshow into a stunning and wondrous one with Snowman Pie Chart PPT. Download it now!
Write Your Own Review

Related Products


