

Table Infographics for PowerPoint and Google Slides
Table Infographics for PowerPoint and Google Slides
(15 Editable Slides)


(15 Editable Slides)
Related Presentation Templates
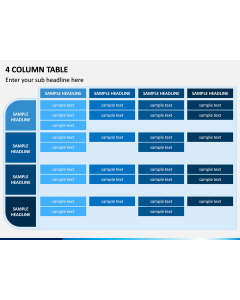
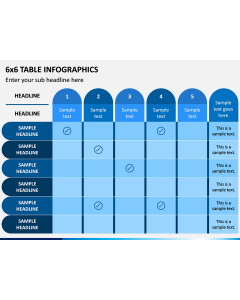
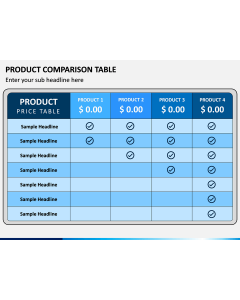
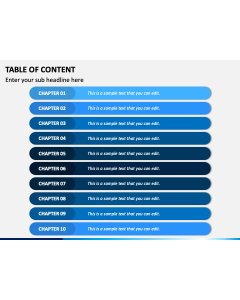
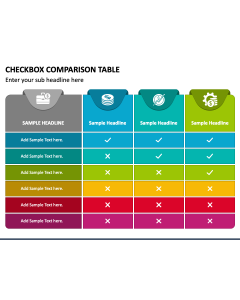
Easily compare and contrast data points
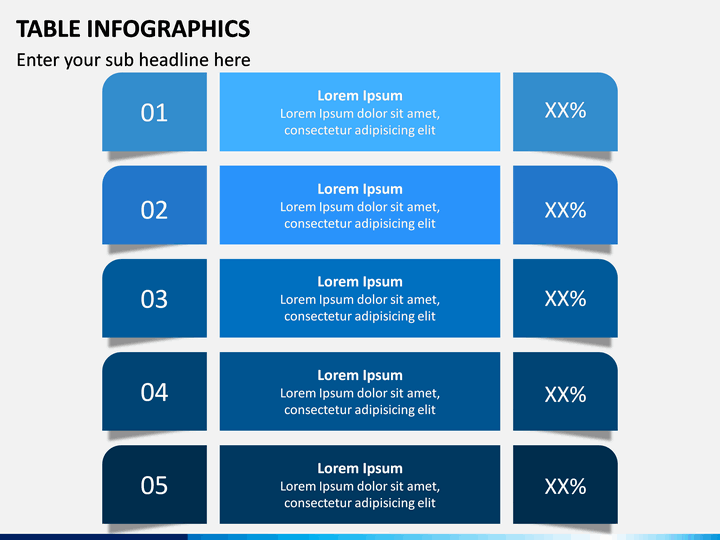
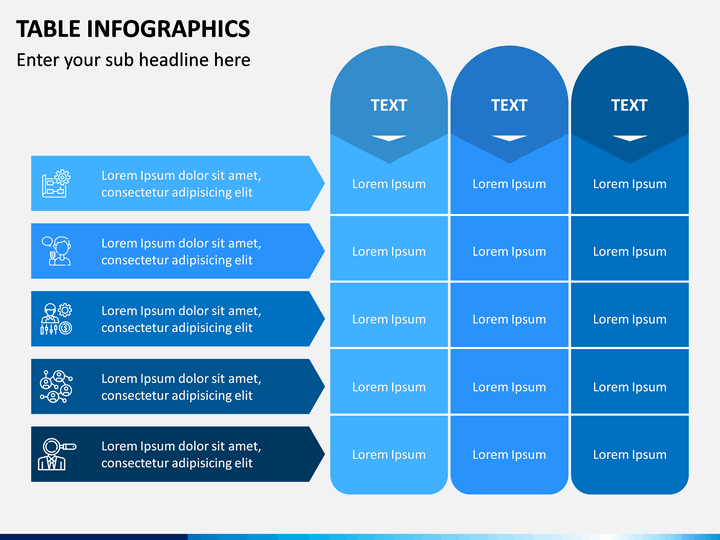
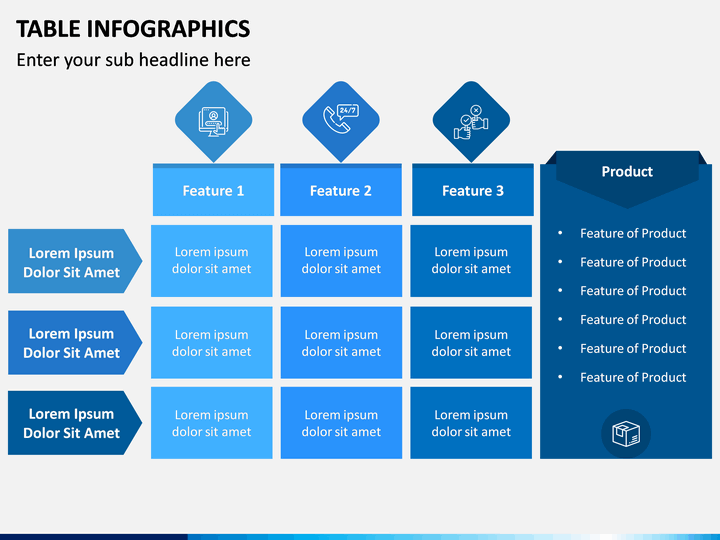
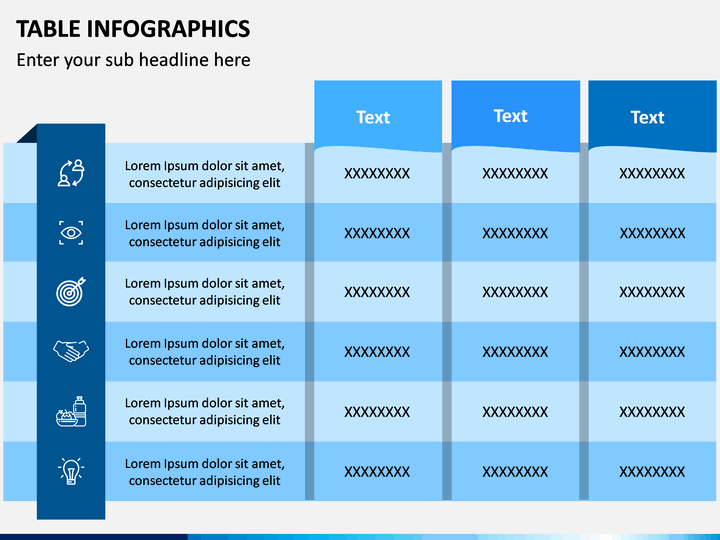
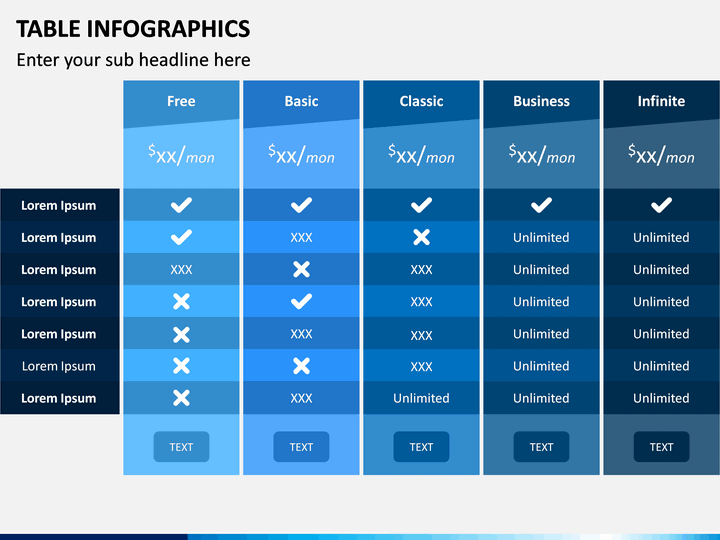
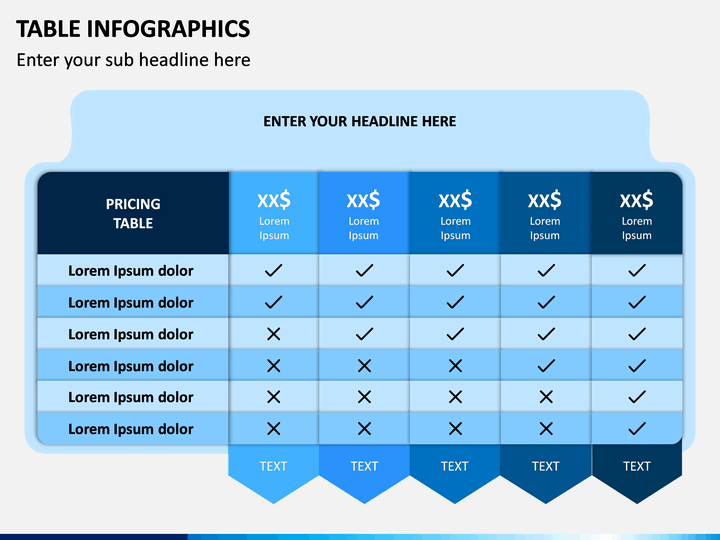
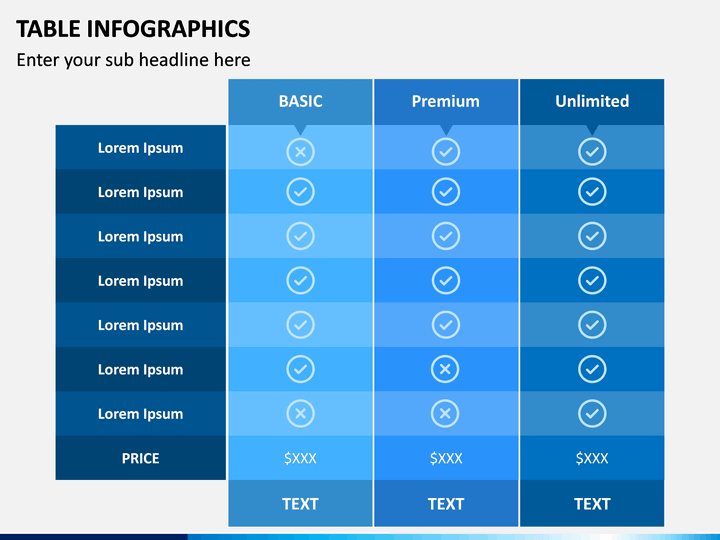
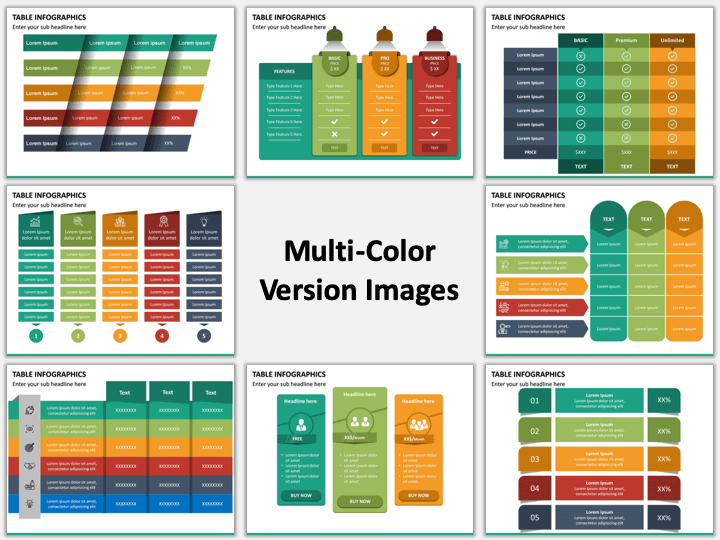
Creating a meaningful and impactful presentation can be challenging, especially if you have to incorporate numerous data points. Comparing and contrasting data points can be particularly difficult. One of the best ways to do this is by using a table. Creating a useful table is both an art and a science. It can be frustrating if you aren’t able to master both of these aspects. But using our Table Infographics PowerPoint template, this process is made easier.
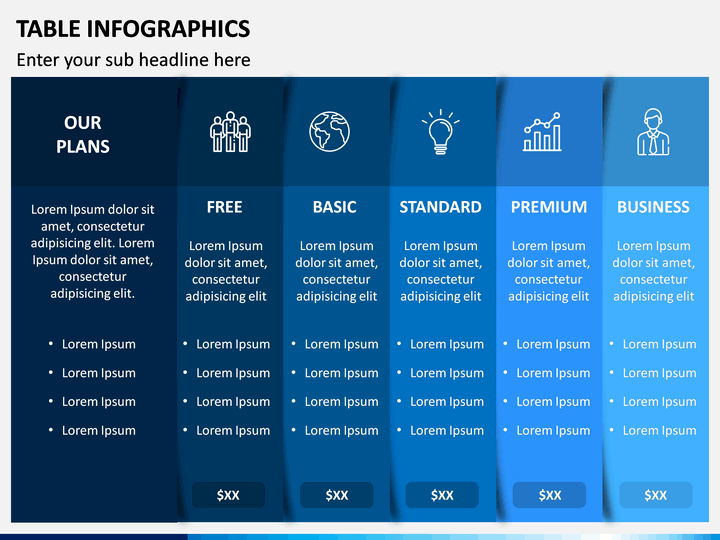
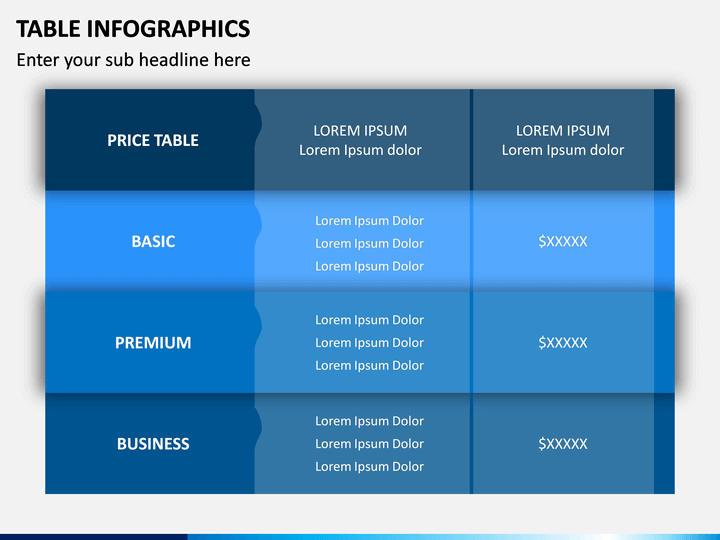
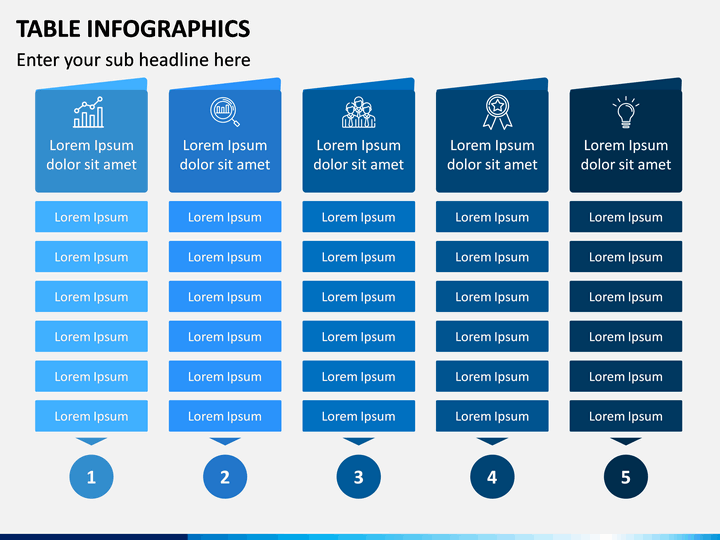
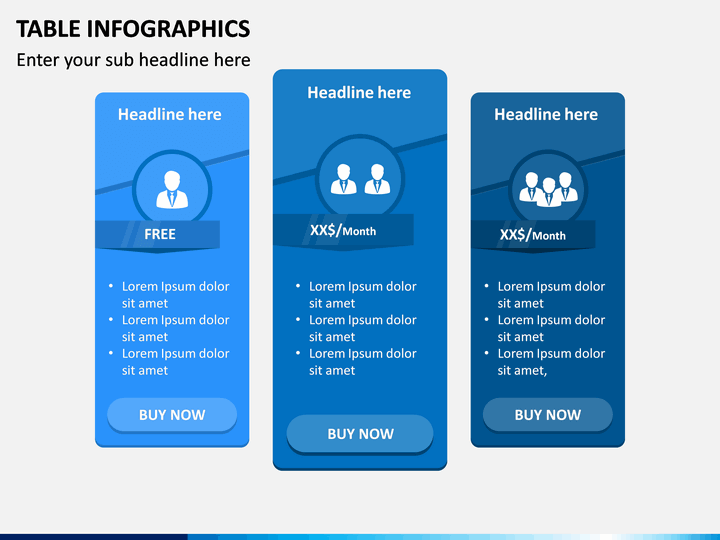
This presentation template features several table infographics that you can choose from. Whether you want to compare and contrast prices, products, results, or goals, these infographics are well suited to help you deliver.
High-quality infographics
What good are infographics if they aren’t high-quality? To ensure that all of the infographics in this set are top tier, we have partnered with professional designers. They’ve worked hard to create all the slides and visual aids in this set. Additionally, they’ve formatted all of these infographics, so they are in HD vector form. This means that they are all easy to edit and adapt, depending on your objectives. This also means that adding in your data points and inputting your final infographic into pre-existing materials will also be easy. Don’t worry if you don’t have a background in design. You don’t need it to adapt these infographics.
Enjoy a range of additional benefits
This Table Infographics presentation template also has a range of other benefits. These include:
- Pre-prepared PPT slides: All of the slides and graphics in this set have been pre-prepared based on the latest trends and insights in this space. You can rest assured that you’ll be using reliable materials.
- Different color themes: We want you to have as many options as possible when it comes to your infographics. We have formatted this set so that it is available in two different color themes.
- Compatibility: Creating a presentation is already a difficult process. We don’t want to force you to use the software you aren’t comfortable with. This set is specifically designed so that it can be used on Microsoft PowerPoint, Apple Keynote, and Google Slides.