Table with Numbers PowerPoint and Google Slides Template
(6 Editable Slides)
Table with Numbers PowerPoint and Google Slides Template
Available For
Telling your mind may not be an art but telling it right surely is. Your fabulous communication skills too sometimes need a little push to bring this art to reality. Apt and appropriate visual aids with catching graphics turn up as one great solution for this. Understanding this potent power of apt illustrations, we bring to you pre-made PowerPoint Table and Numbers Template. This will help you save your time that you otherwise spend in creating the slides from the scratch. Professionally handled and innovatively built, you get to express your point in most unique way. So, you can explain anything about numbers without making your point dull, boring or too heavy to be understood.
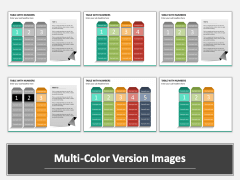
This deck of 6 slides is a boon for anything for which you need numbers to express the main point. From annual accounts report to financial evaluation of your business, you can use it for various different purposes. Even for displaying different steps and stages of a process such as manufacturing, marketing and so on, you can use the set. From project management to task allotment and market share analysis to product or service demonstration, it will be best for expressing various ideas.
About
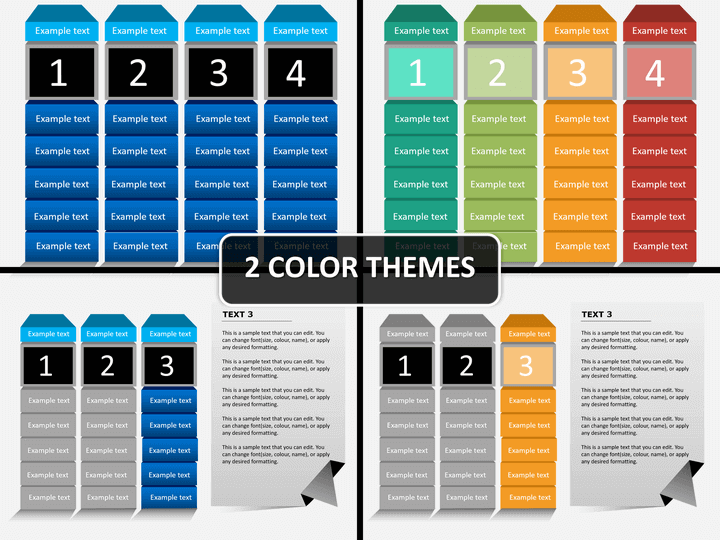
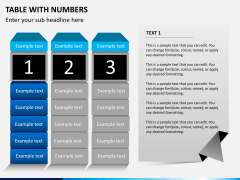
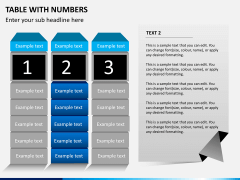
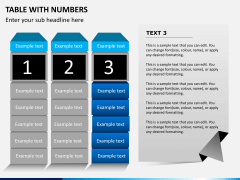
Table with Numbers are basically simple tables that have numbers presented on the top and space for including your content below them in various rows and columns. They are apt for displaying information related to project management and task management and other similar data illustration. Quite popular with business presenters, these are often used for comparing data and evaluating results and observations. From scaling information to decision making, these prove most versatile choice for visualizing data.

