

Free - 6x12 Table for PowerPoint and Google Slides
Free - 6x12 Table for PowerPoint and Google Slides
(1 Editable Slide)
Product Details
(1 Editable Slide)
Available For
PowerPoint
Keynote
Google Slides
Canva Slides
Animation:
Yes
Related Presentation Templates
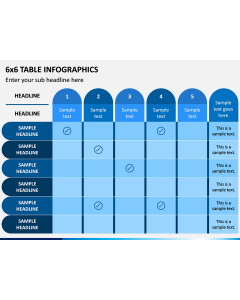
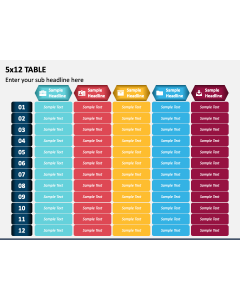
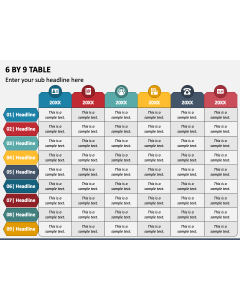
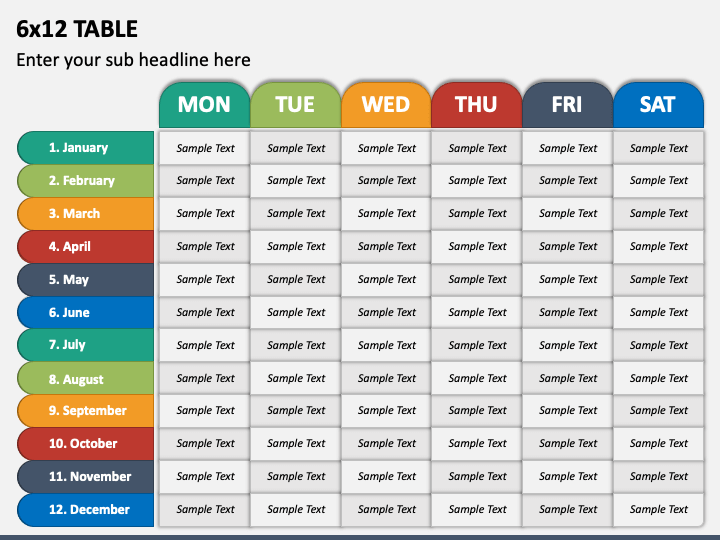
Download our versatile 6x12 Table presentation graphic for Microsoft PowerPoint and Google Slides to represent various topics creatively and engagingly. It features an editable tabular infographic with six columns and twelve rows. You can use this infographic in your presentations to present unstructured data and information in a clear and concise manner, helping the audience understand key points quickly. The table graphic comes in handy to represent relationships between different variables. Finance managers can also provide a comprehensive overview of monthly and annual sales, revenues, profitability, and expenses.
Salient Features
- You can quickly make changes without investing much time or effort.
- The high-quality graphic retains the original resolution, even when scaled to a bigger screen.
- The visual has been carefully crafted to ensure no room for copyright infringement incidents.
- The PPT can be used for a lifetime after downloading it only once.
Make this compelling slide yours now to give your presentations a unique visual appeal!