

2 Year Comparision
2 Year Comparision
(1 Editable Slide)

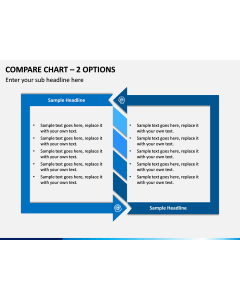
Leverage our 2 Year Comparison graphic for Microsoft PowerPoint and Google Slides to strengthen your presentations visually. The PPT portrays unique illustrations embedded with incredible icons in vibrant color tones. The subtle background, incredible design, and spectacular layout make your slideshow appealing.
Finance and accounting professionals can capitalize on this exclusively designed PPT to represent the comparison between the financial performance of two years. Marketing and sales managers can demonstrate market trends, sales growth, and campaign performance over two years. Business analysts can use this design to showcase consumer behavior, market data, and business trends changes over two years. HR heads can depict the comparison of turnover rates, employee performance, and recruitment strategies over two years.
Distinct Features
- The high-definition vector lets you display the content on different screen sizes without affecting the resolution.
- You can make necessary modifications hassle-free without editing skills or technical experience.
- The visual has been created after thorough consideration to prevent copyright problems.
- Our diligent customer support representatives are available round-the-clock to resolve your doubts.
Download this remarkable slide now!