

3x10 Table for PowerPoint and Google Slides
3x10 Table for PowerPoint and Google Slides
(1 Editable Slide)
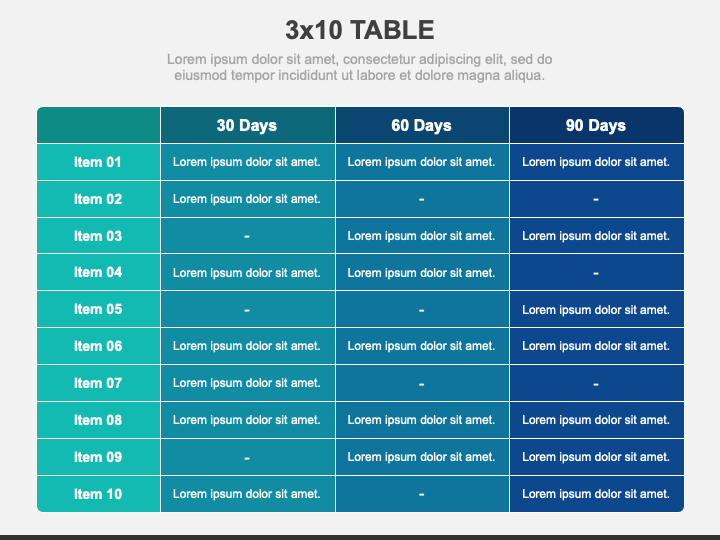
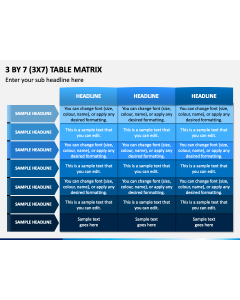
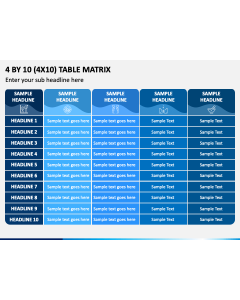
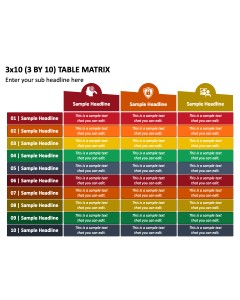
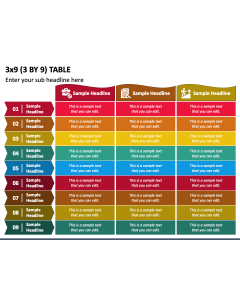
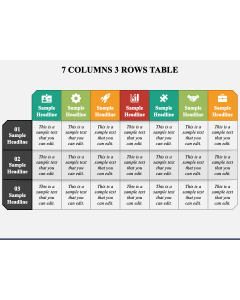
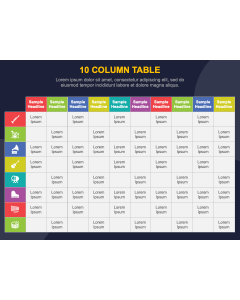
Download our 3x10 Table for PowerPoint and Google Slides to highlight a wide range of information in a visually appealing way. The slide features a tabular infographic of three columns and ten rows in a unique color combination. Each cell has sufficient space to insert the desired content.
Project managers can leverage this illustration to depict milestones or tasks in different project stages. Sales professionals can use this infographic to demonstrate sales growth for various products or market segments over 90 days. Content creators and digital marketing experts can exhibit the content marketing schedule for publishing different types of content. Health and fitness professionals can display a client’s progress over 90 days, including weight, body fat percentage, and other fitness milestones. Additionally, the layout is an ideal choice for representing financial plans, educational goals and achievements, website analytics, and more.
Features
- Easy customization enables presenters to make changes without special tools or external support.
- The visual objects ensure uninterrupted resolution, even when projected on a bigger screen.
- No user will face copyright issues since everything has been thoughtfully designed.
Download this PPT to make your presentations more engaging!