5 By 9 Table
5 By 9 Table
(1 Editable Slide)
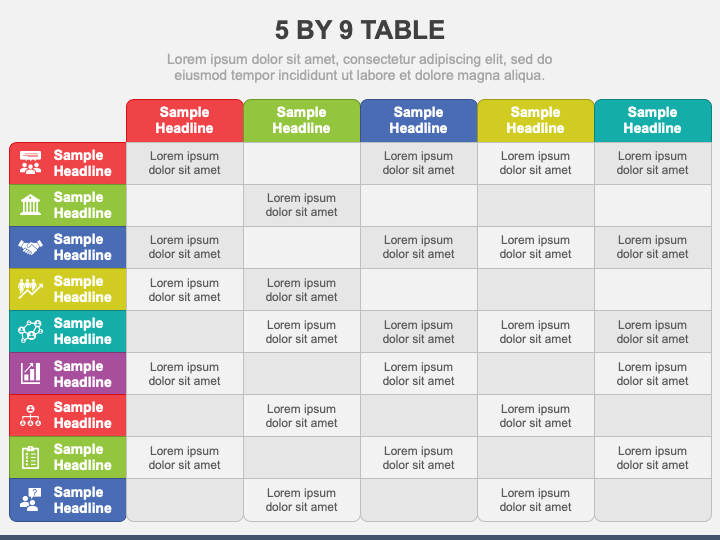
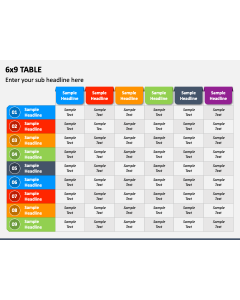
Download our 5 By 9 Table graphic for PowerPoint and Google Slides to portray a variety of information in a structured and visually appealing manner. The slide comprises a tabular infographic of five columns and nine rows. It is accompanied by vibrant color contrasts, appealing icons, and editable text placeholders to let you convey your ideas and thoughts confidently.
Sales professionals can use this infographic in their presentations to display sales and revenue data over a specific period, highlighting the growth trends. Project managers can depict the progress of different projects, including key deliverables, accountable people, outcomes, and more. You can also use this versatile infographic to illustrate the comparative overview of products and services based on various features and attributes, budget allocation for different departments, and more.
Features
- You can quickly make the changes to the design elements to align the slide with your presentation’s theme.
- The graphic quality will remain consistent on all screen dimensions.
- Our designers have thoughtfully designed the illustration to avoid copyright violation issues.
- Assured 24/7 accessible customer support.
Download this PPT to enhance the visual appeal of your presentations!
