9x4 Table
9x4 Table
(1 Editable Slide)
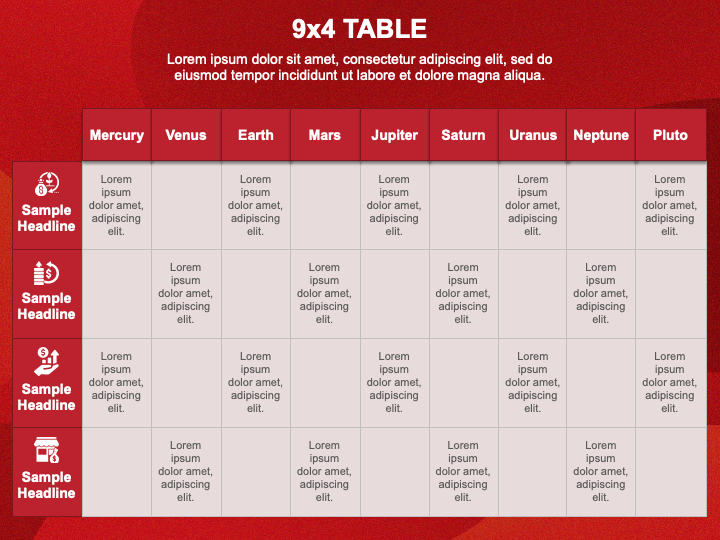


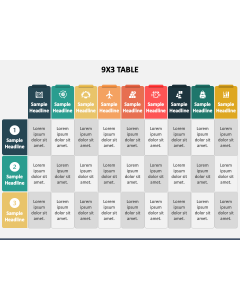
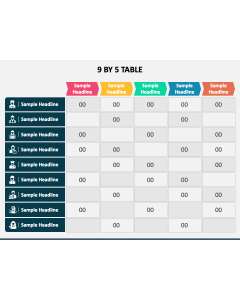
Our 9x4 Table graphic for PowerPoint and Google Slides is an ideal choice to showcase voluminous information in an organized manner. The slide features a tabular infographic of nine columns and four rows. It is adorned with beautiful colors, appealing icons, and entirely editable textual boxes.
Educators can use this illustration in their presentations to provide information about the characteristics of the planets, the significant discoveries on each planet, etc. Business development professionals can use this editable infographic to display a comparative overview of the features and characteristics of different products, services, or options. Project managers can highlight a project’s phases, tasks, milestones, deadlines, etc., over a period of time. Additionally, you can depict survey responses, financial data, sales or growth trends, and more.
Features
- You can quickly resize or recolor the infographic without technical expertise or external support.
- The graphic quality won’t get disturbed, even when projected on a bigger display.
- Everything is thoughtfully designed to keep copyright issues at bay.
- Assured 24/7 accessible customer support.
Download this PPT to infuse your presentations with creativity and elegance!