

BI and Data Analytics PowerPoint and Google Slides Template
BI and Data Analytics PowerPoint and Google Slides Template
(8 Editable Slides)


(8 Editable Slides)
Related Presentation Templates

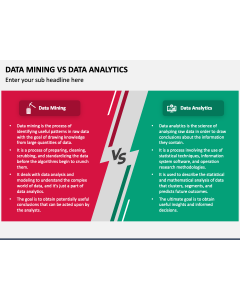

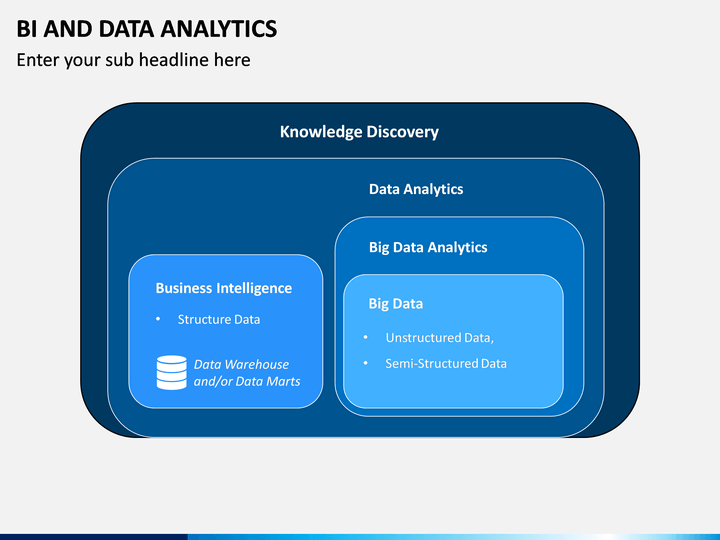
Business Intelligence is the set of processes or instructions that helps to convert raw data into an informative one. This action helps corporate executives make better business decisions, whereas Data Analytics analyzes raw data with the help of algorithms.
These concepts play a role in business growth, and it is imperative for fellow employees to be familiar with them to utilize the available data optimally. So if you are a project manager or a Data Analyst, make use of our BI and Data Analytics PPT template to help your employees, partners, and data team to make them aware of these concepts. You can also make them understand how they can make good business decisions and reuse the data.
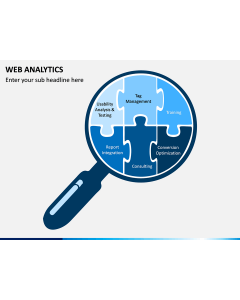
Concept Incorporated for Project Executives
The set offers multiple slides where these concepts are presented in a concise and informative manner. It also comprises easy-to-explain infographics, which will help you make your slides more engaging and attractive for the audiences. Moreover, content relevancy has been maintained throughout the slides, wherein the following topics have also been included:
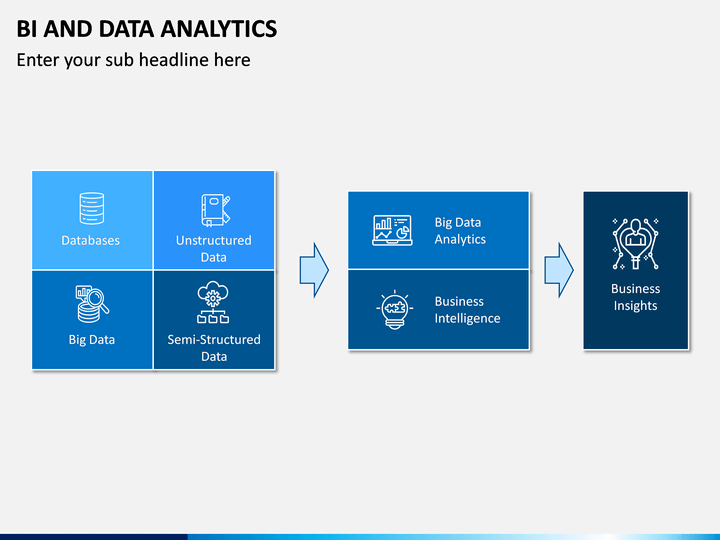
- Introduction about the topic with graphical objects
- Evolution of Analytics
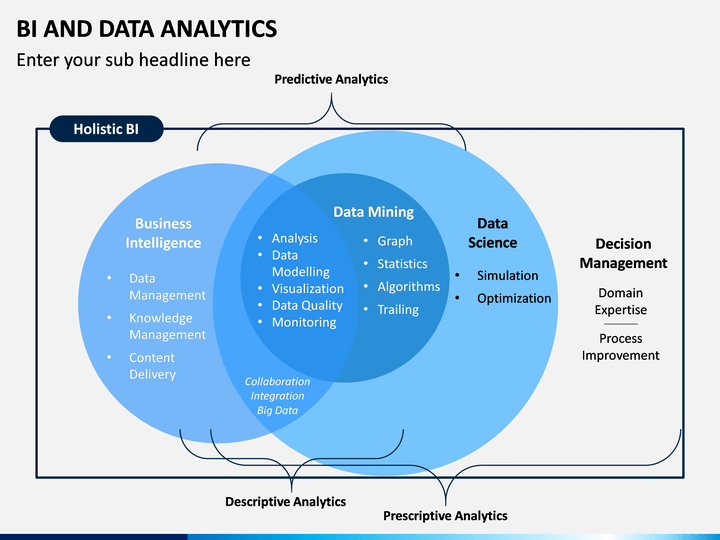
- Holistic BI
- The Modern Analytics Workflow
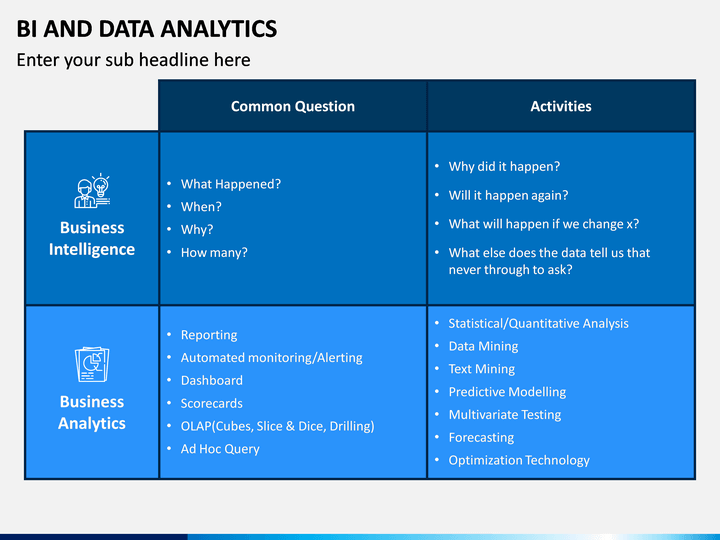
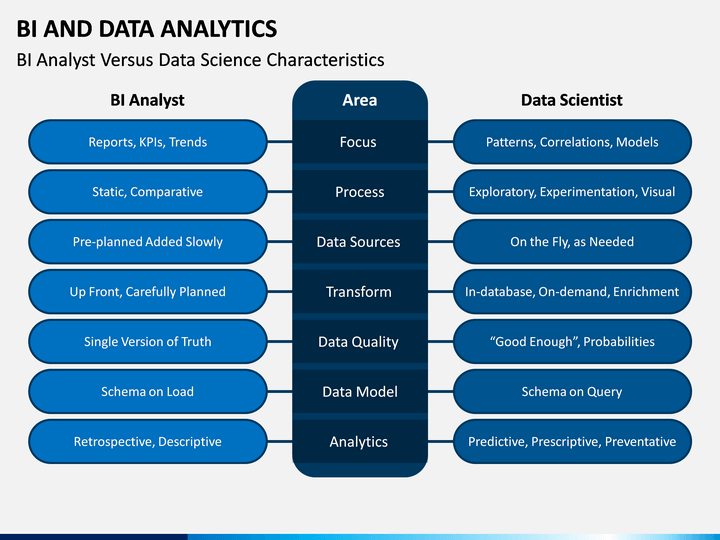
- BI Analyst versus Data Science Characteristics
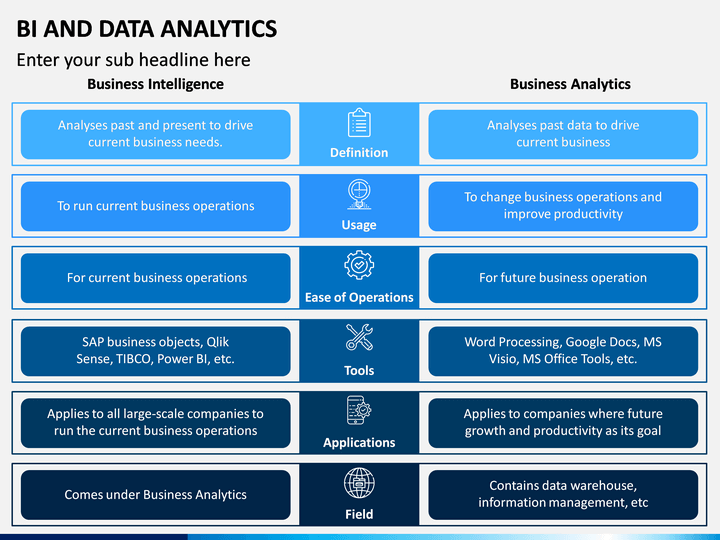
- Difference Between both the Topics
Graphical Objects in Slides
The graphical objects are designed by our professional designers from scratch to avert copyright issues. Keep quality as our priority, these slides are customizable to let you easily add, remove, recolor, resize, or scale-up any content or visual elements. No matter how much you modify the objects, the visual quality will not be affected.
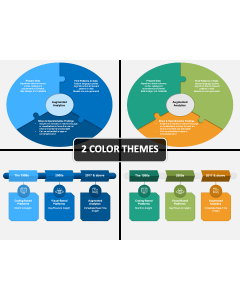
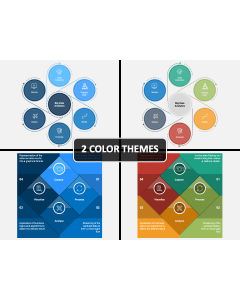
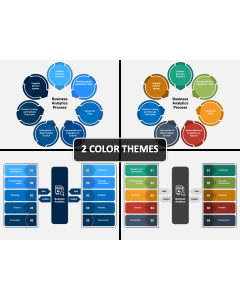
Different Layouts
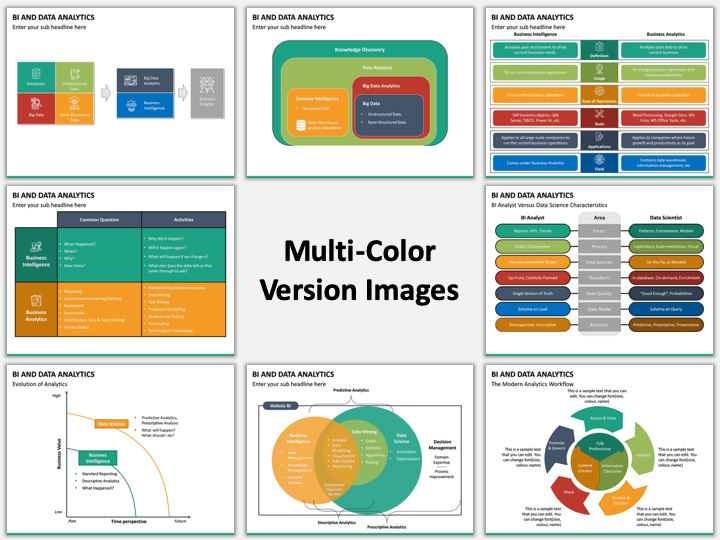
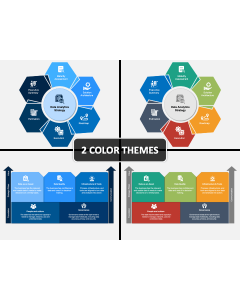
When it comes to designing a presentation, creative layouts and quality content make it more engaging and captivating for the audience. We want our users to be on top. So we have designed the set in two different themes: blue and multicolor. You can easily choose the one which suits your requirements.
Additionally, you can use this slideshow on any platform, be it MS PowerPoint, Apple Keynote, or Google Slides. You can easily modify it on any of them. Also, we have designed the slides in two different aspect ratios - 16:9 and 4:3, which are compatible with both the standard screen and widescreen.
Download our BI and Data Analytics PowerPoint template for an impressive and informative presentation.